

Set up a Scrut Monitor
-
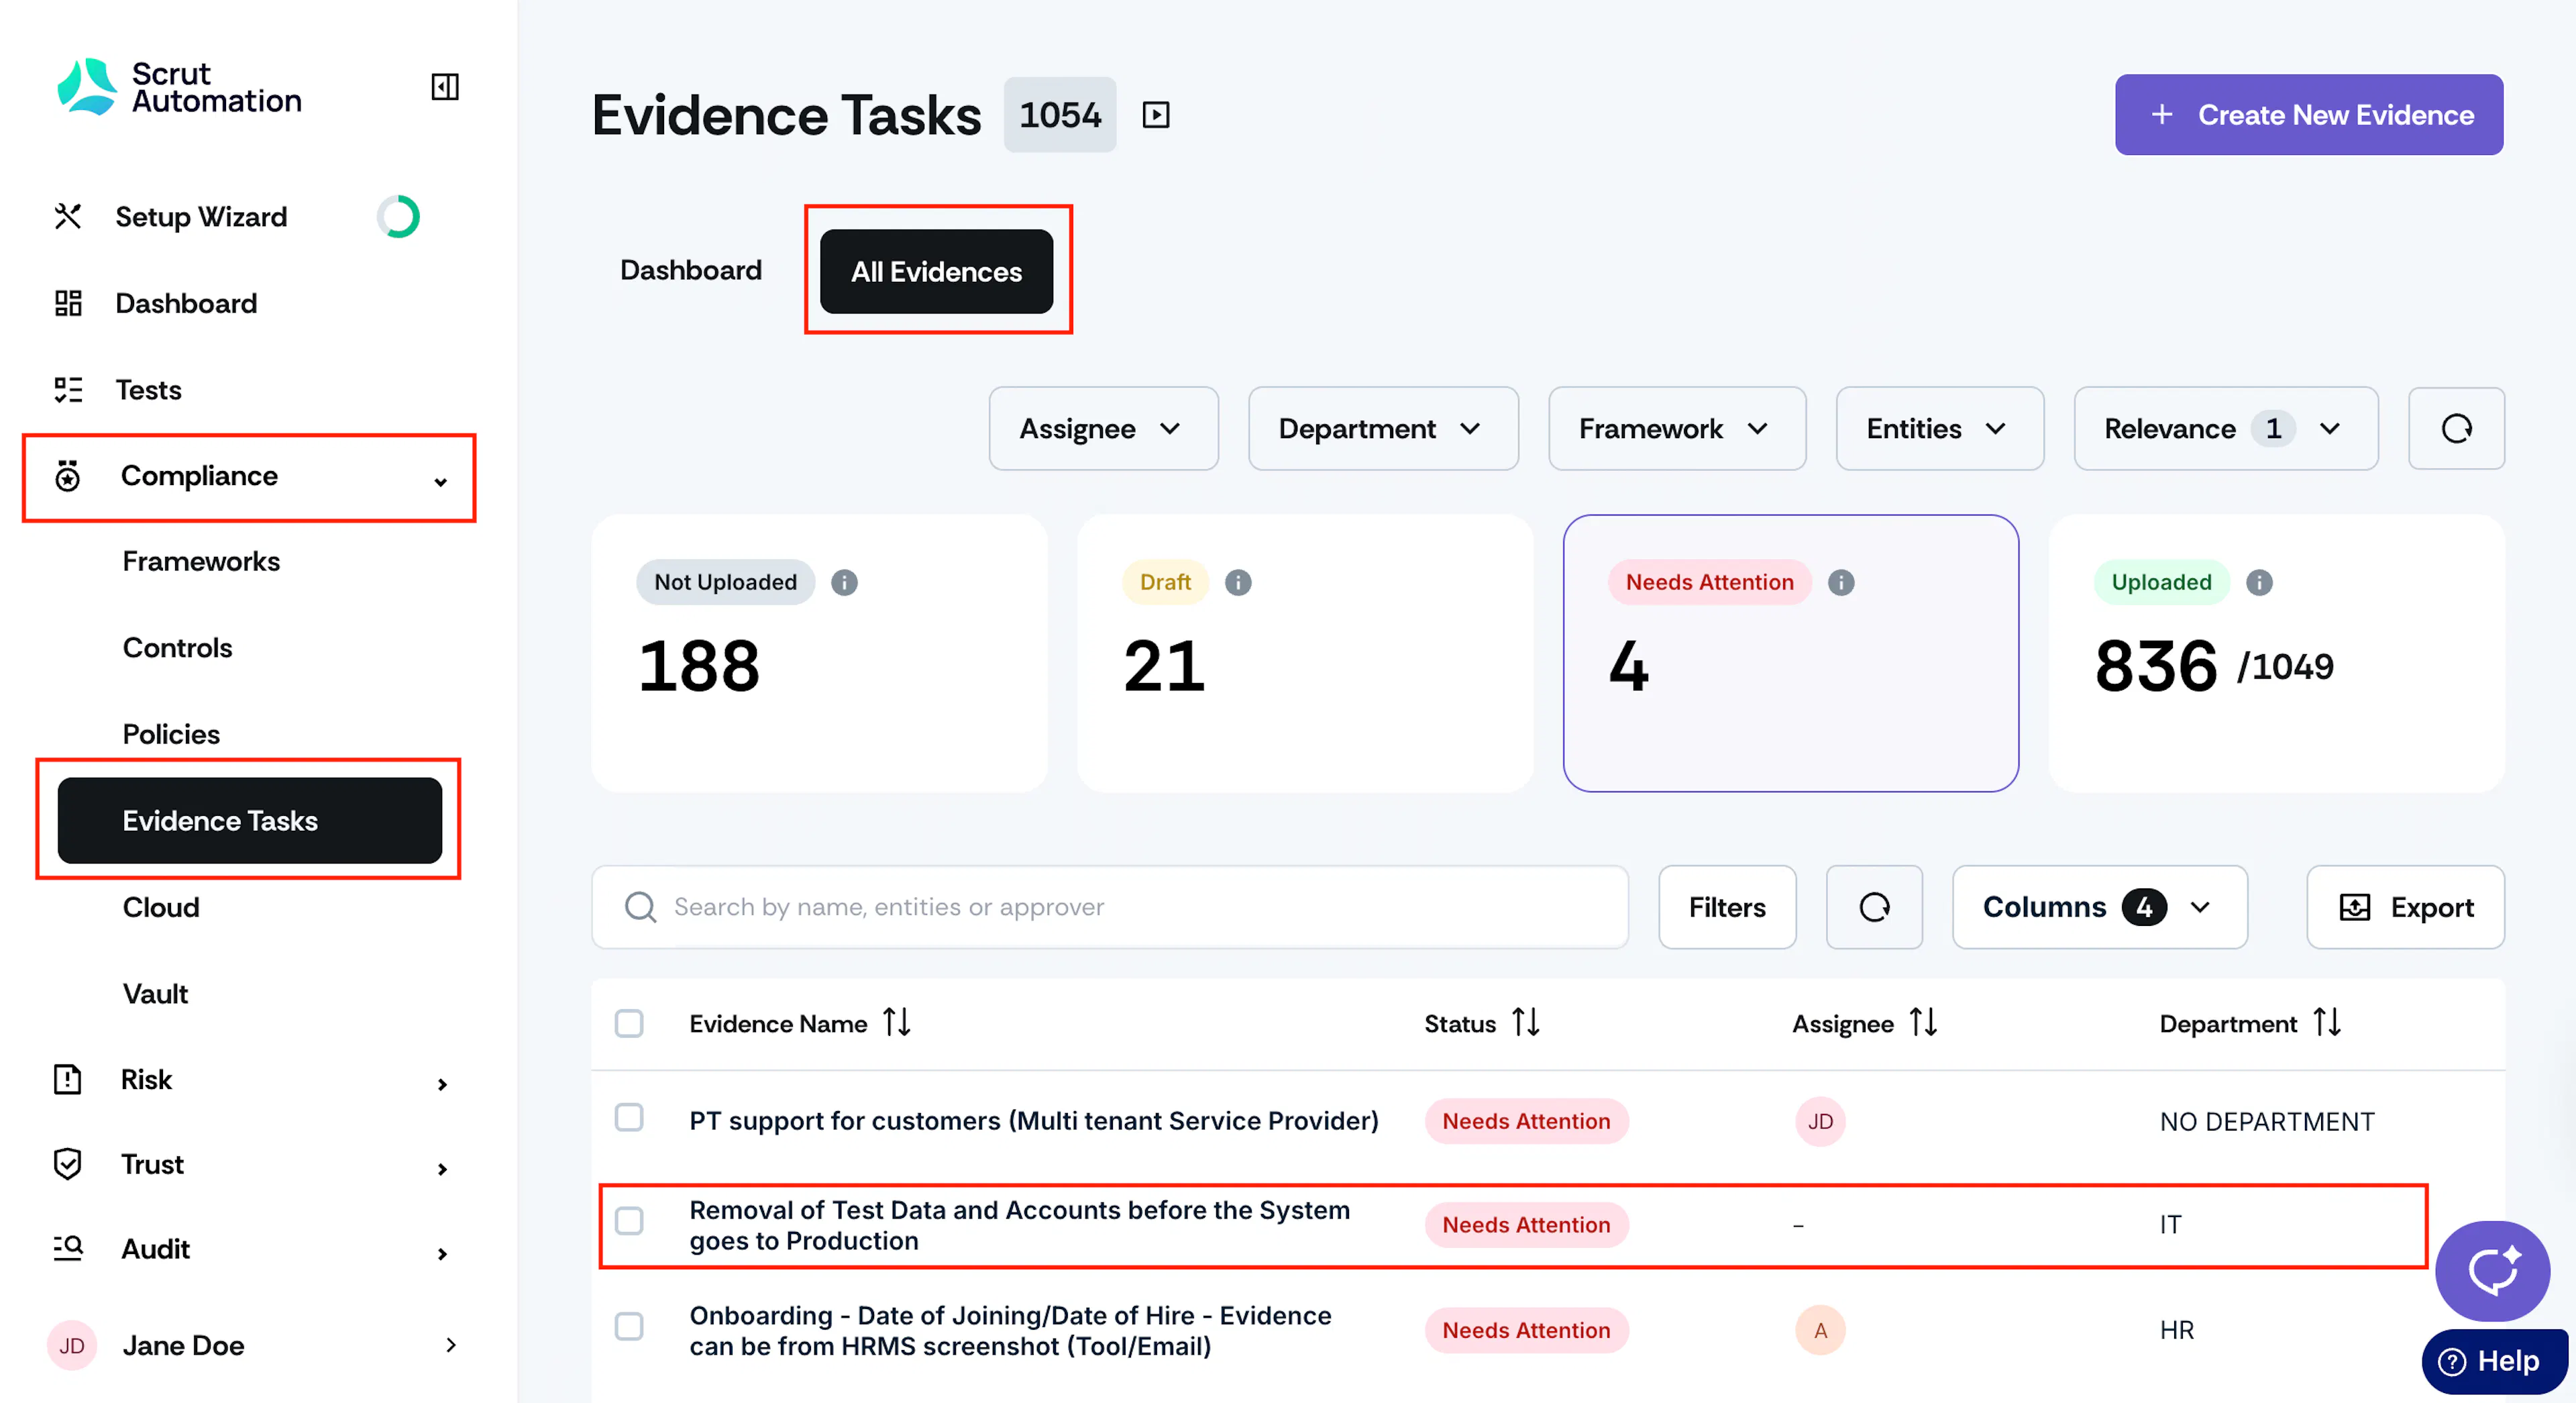
Sign in to Scrut and go to Compliance → Evidence Tasks using the left navigation panel.
-
Click the All Evidences tab.
-
Click on an evidence task that you want to automate using the Scrut Monitor.
-
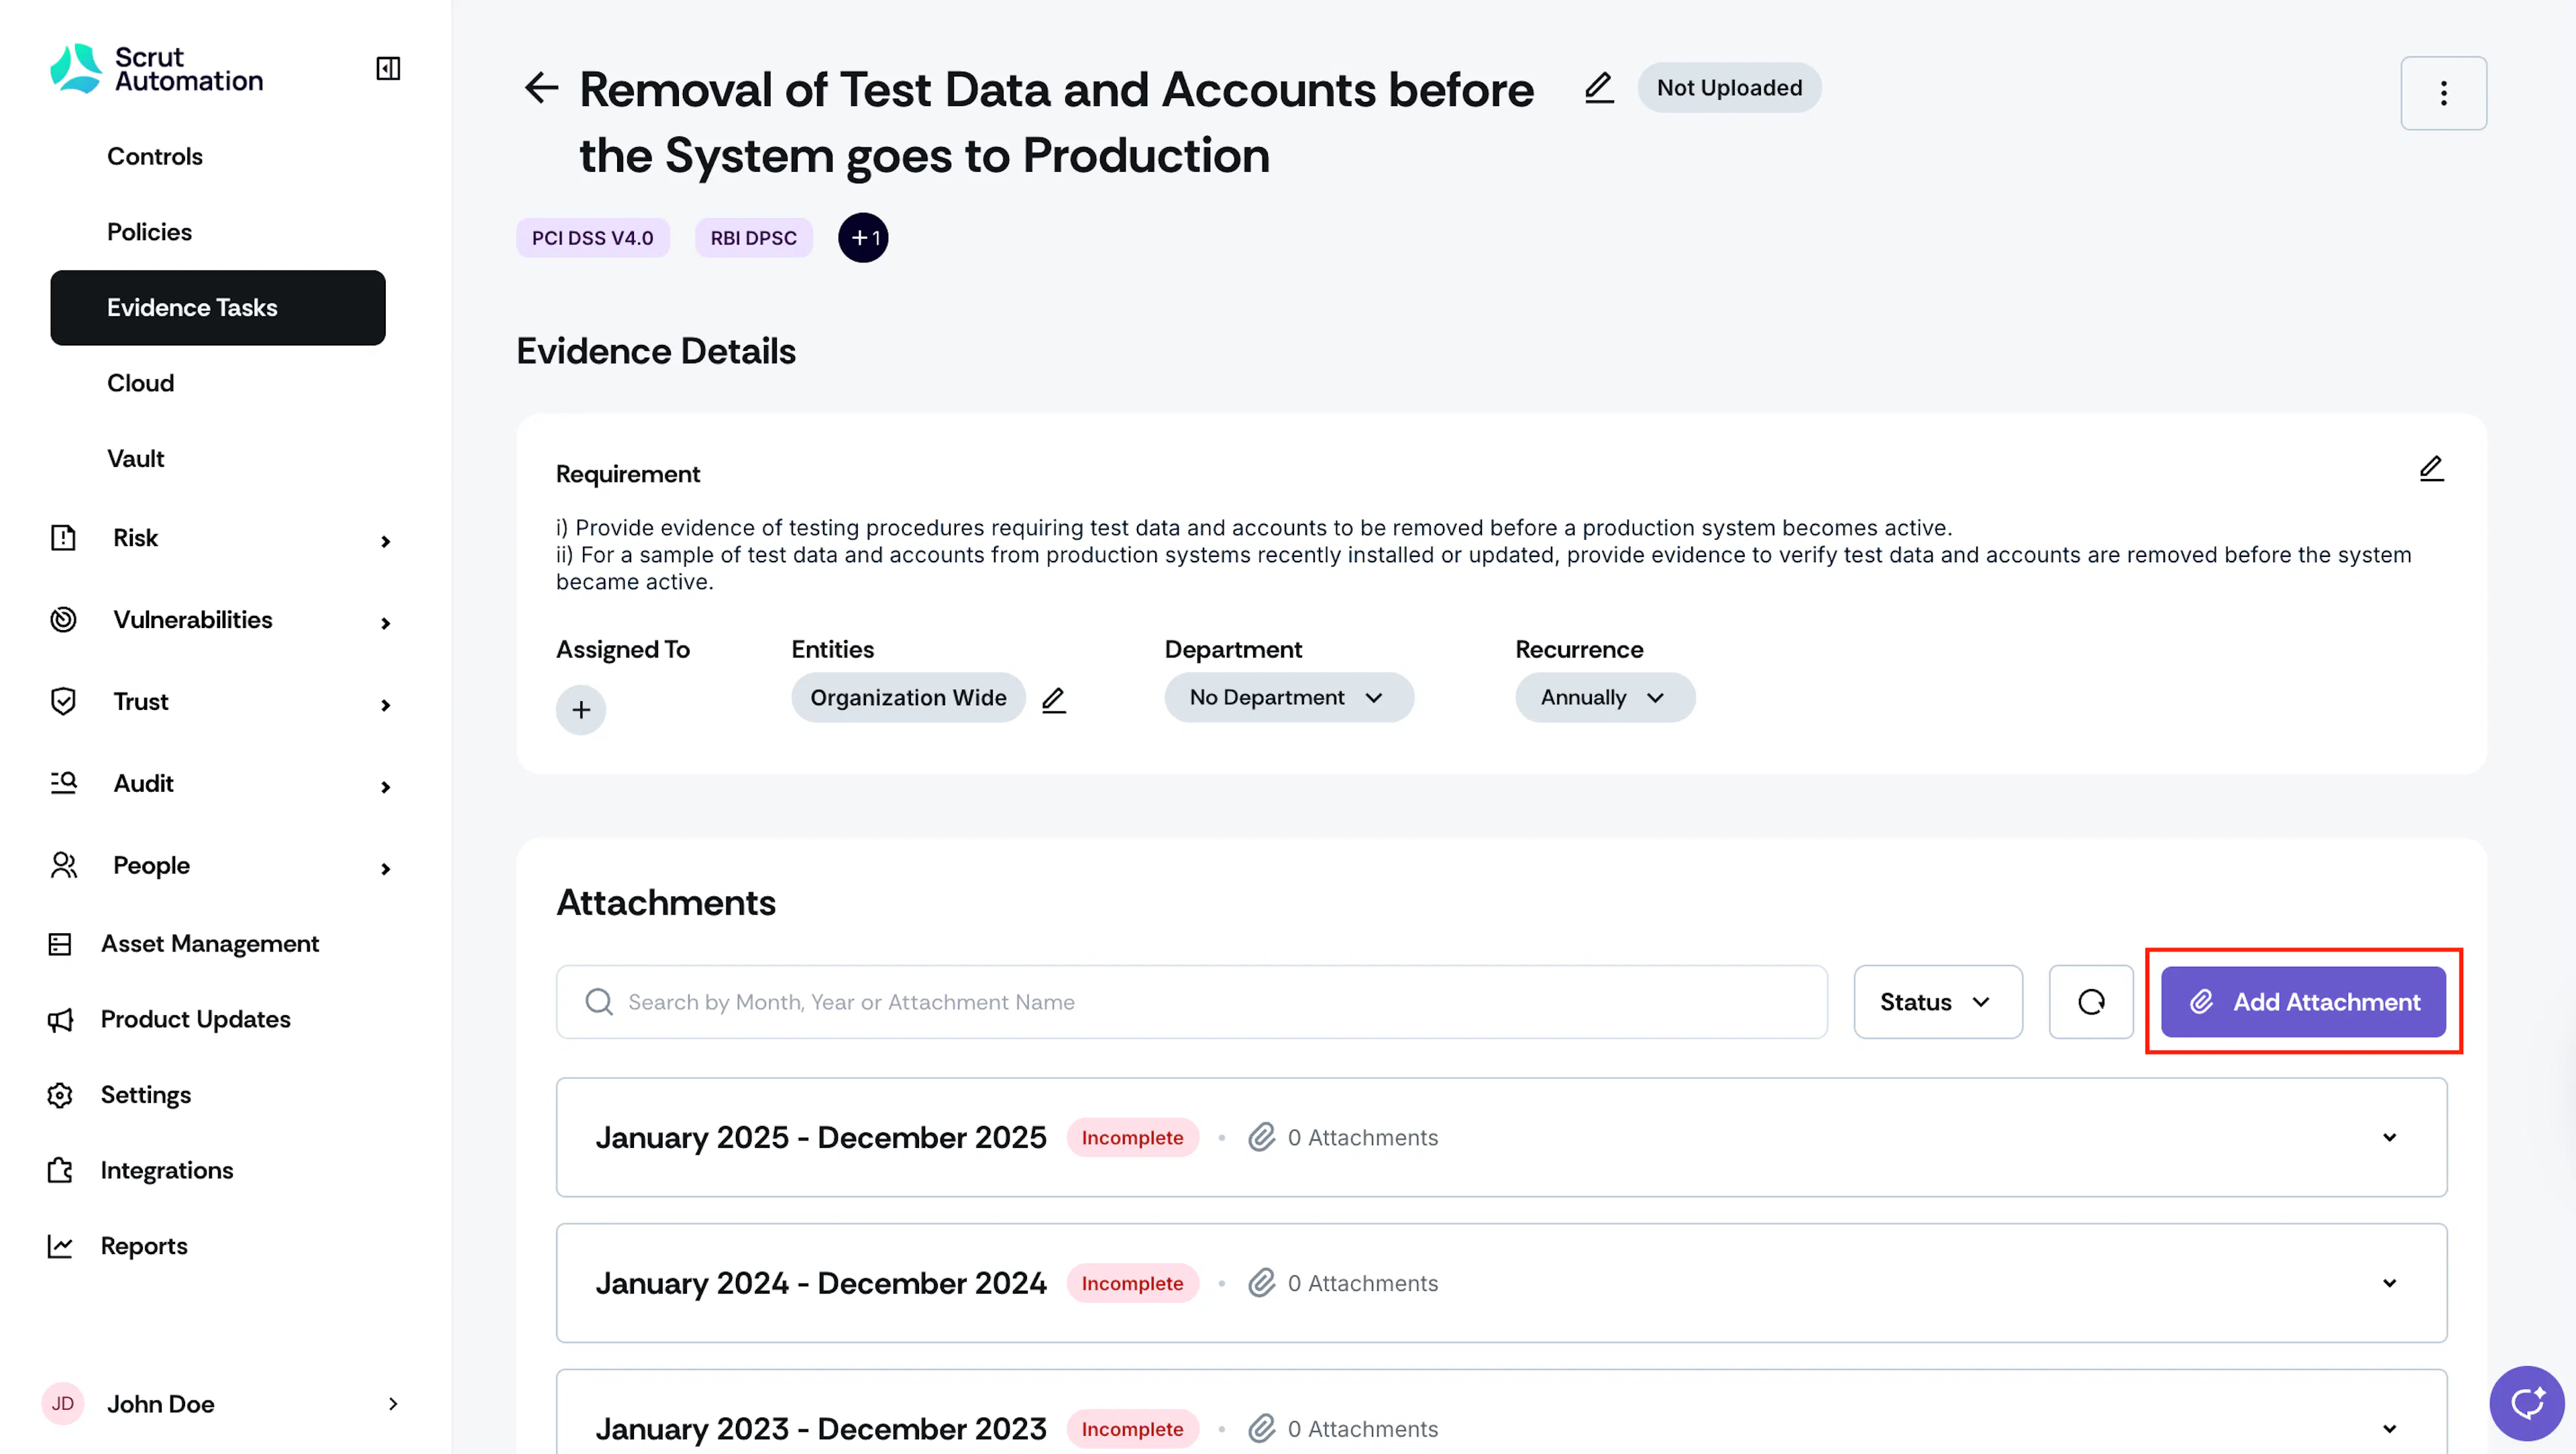
On the Evidence Detail page, click the Add Attachment button.
-
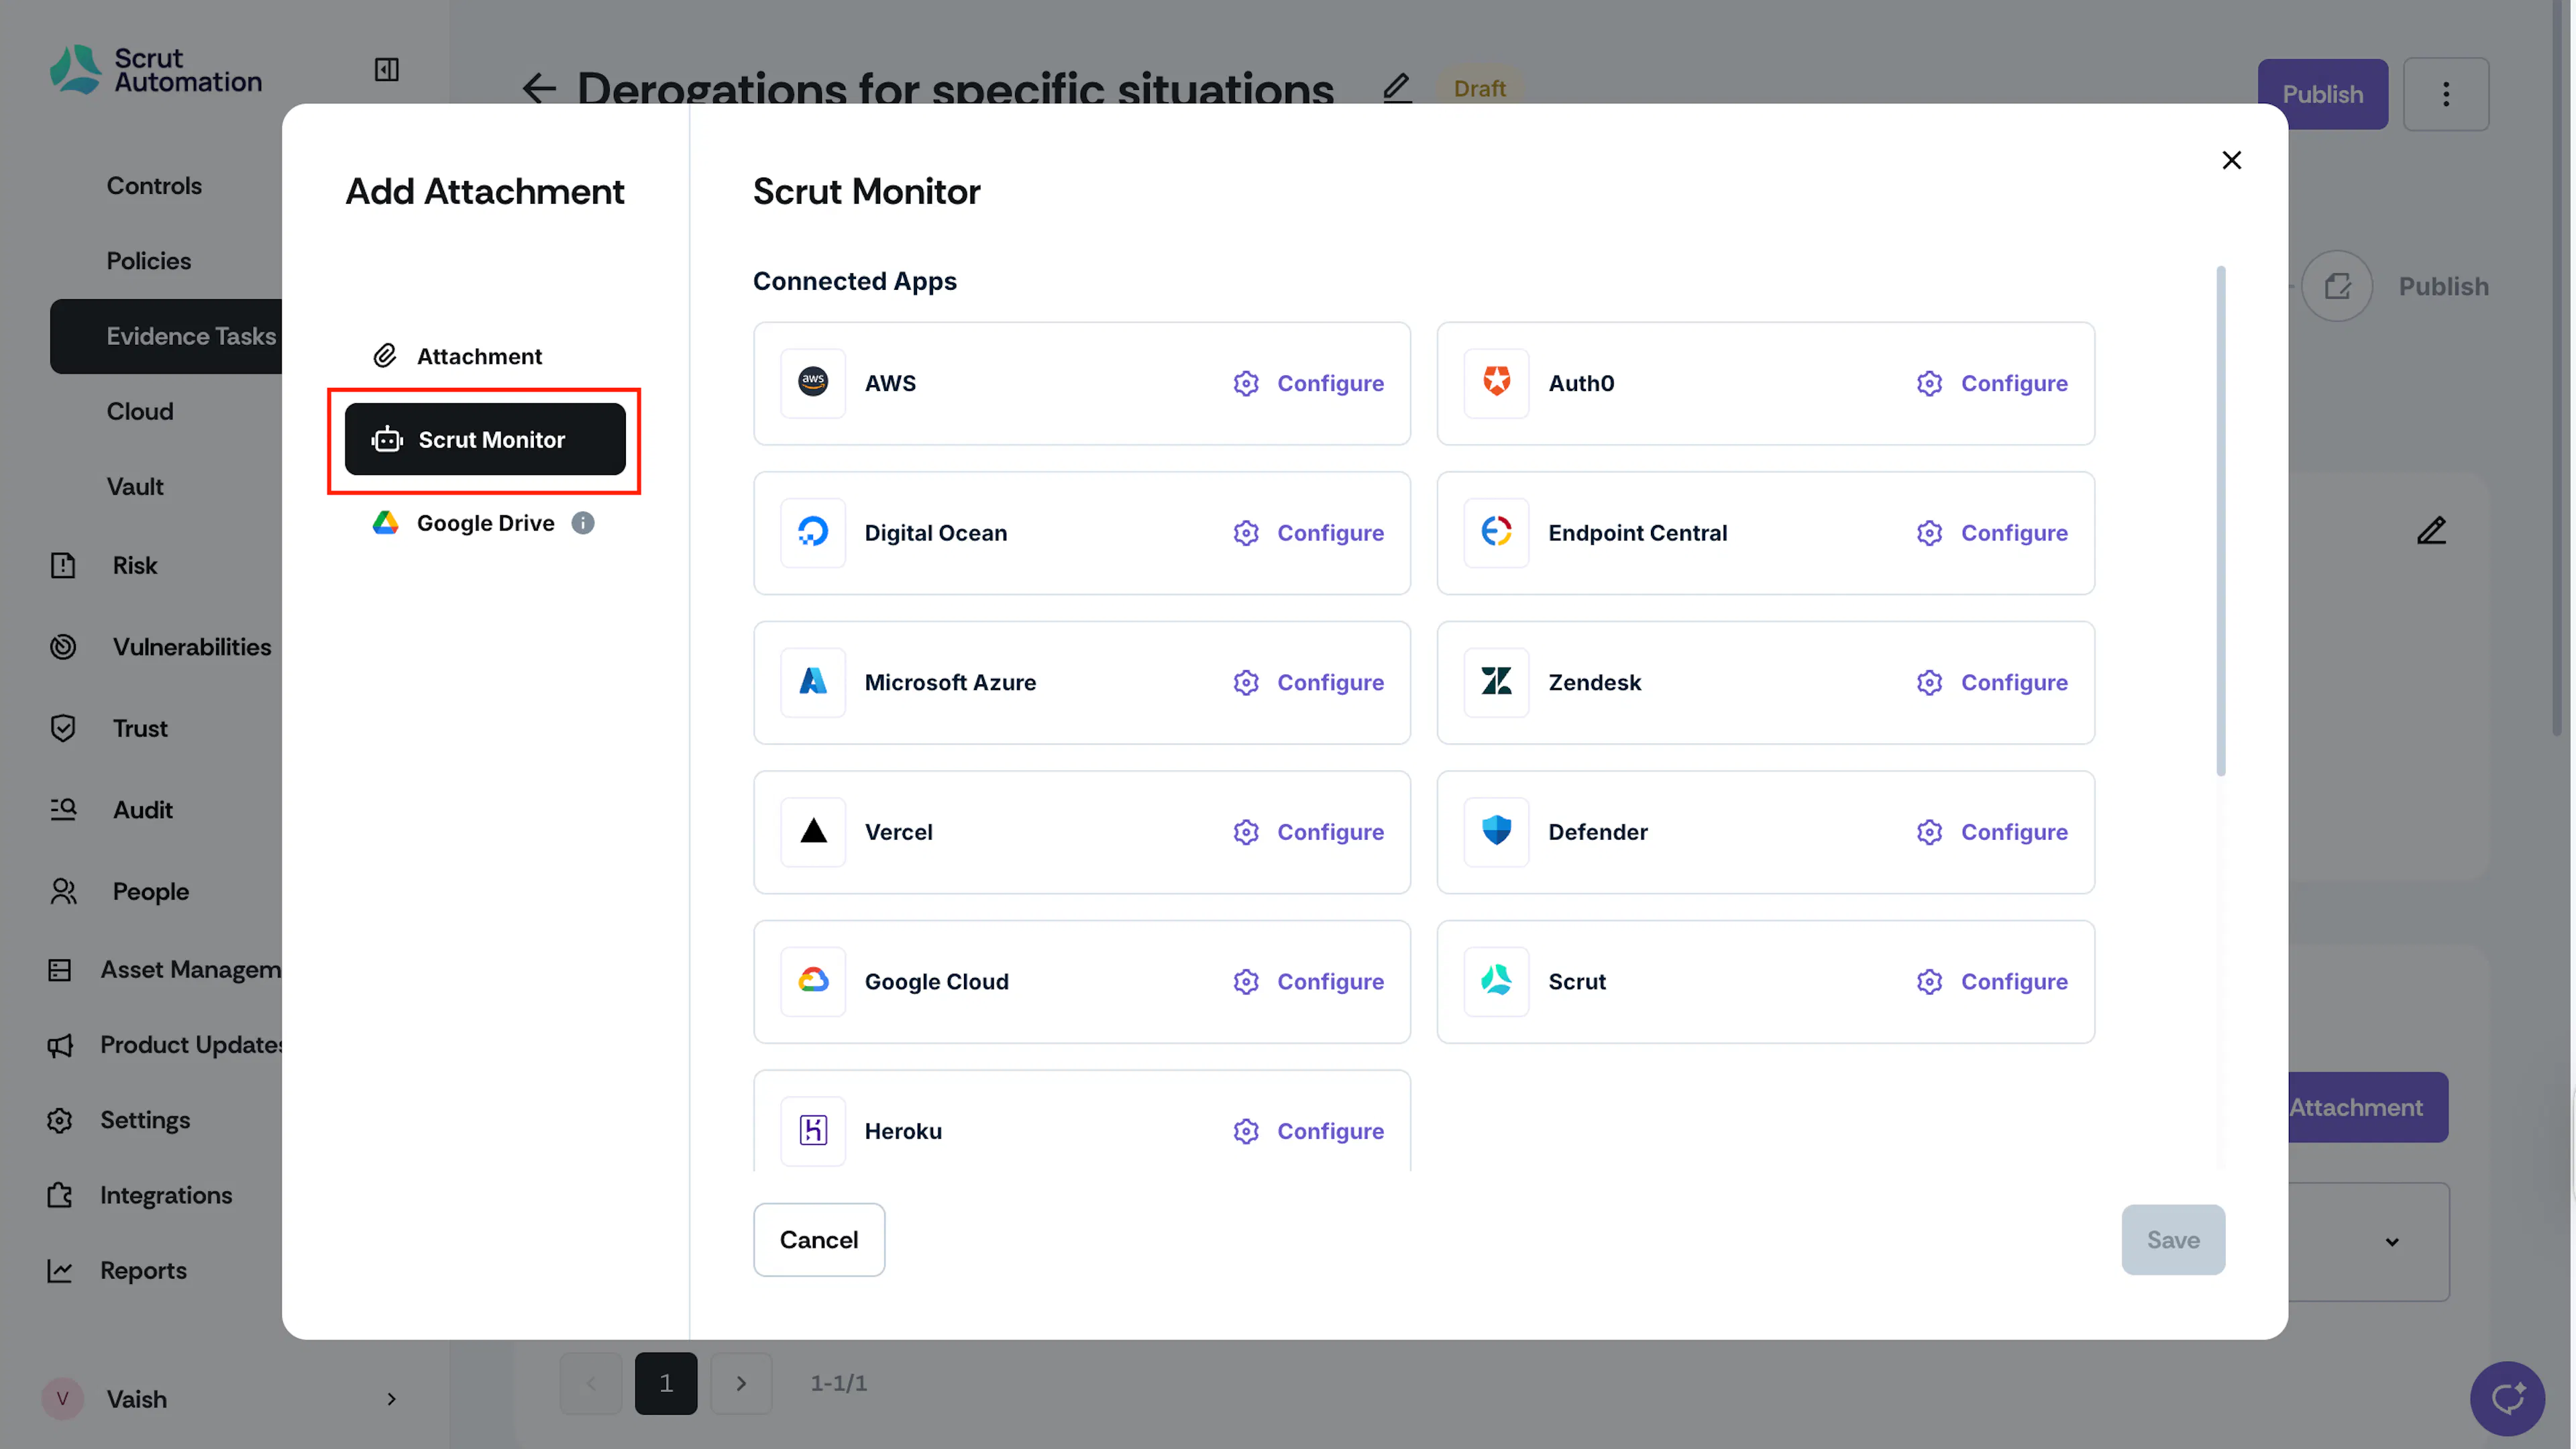
Choose Scrut Monitor.
-
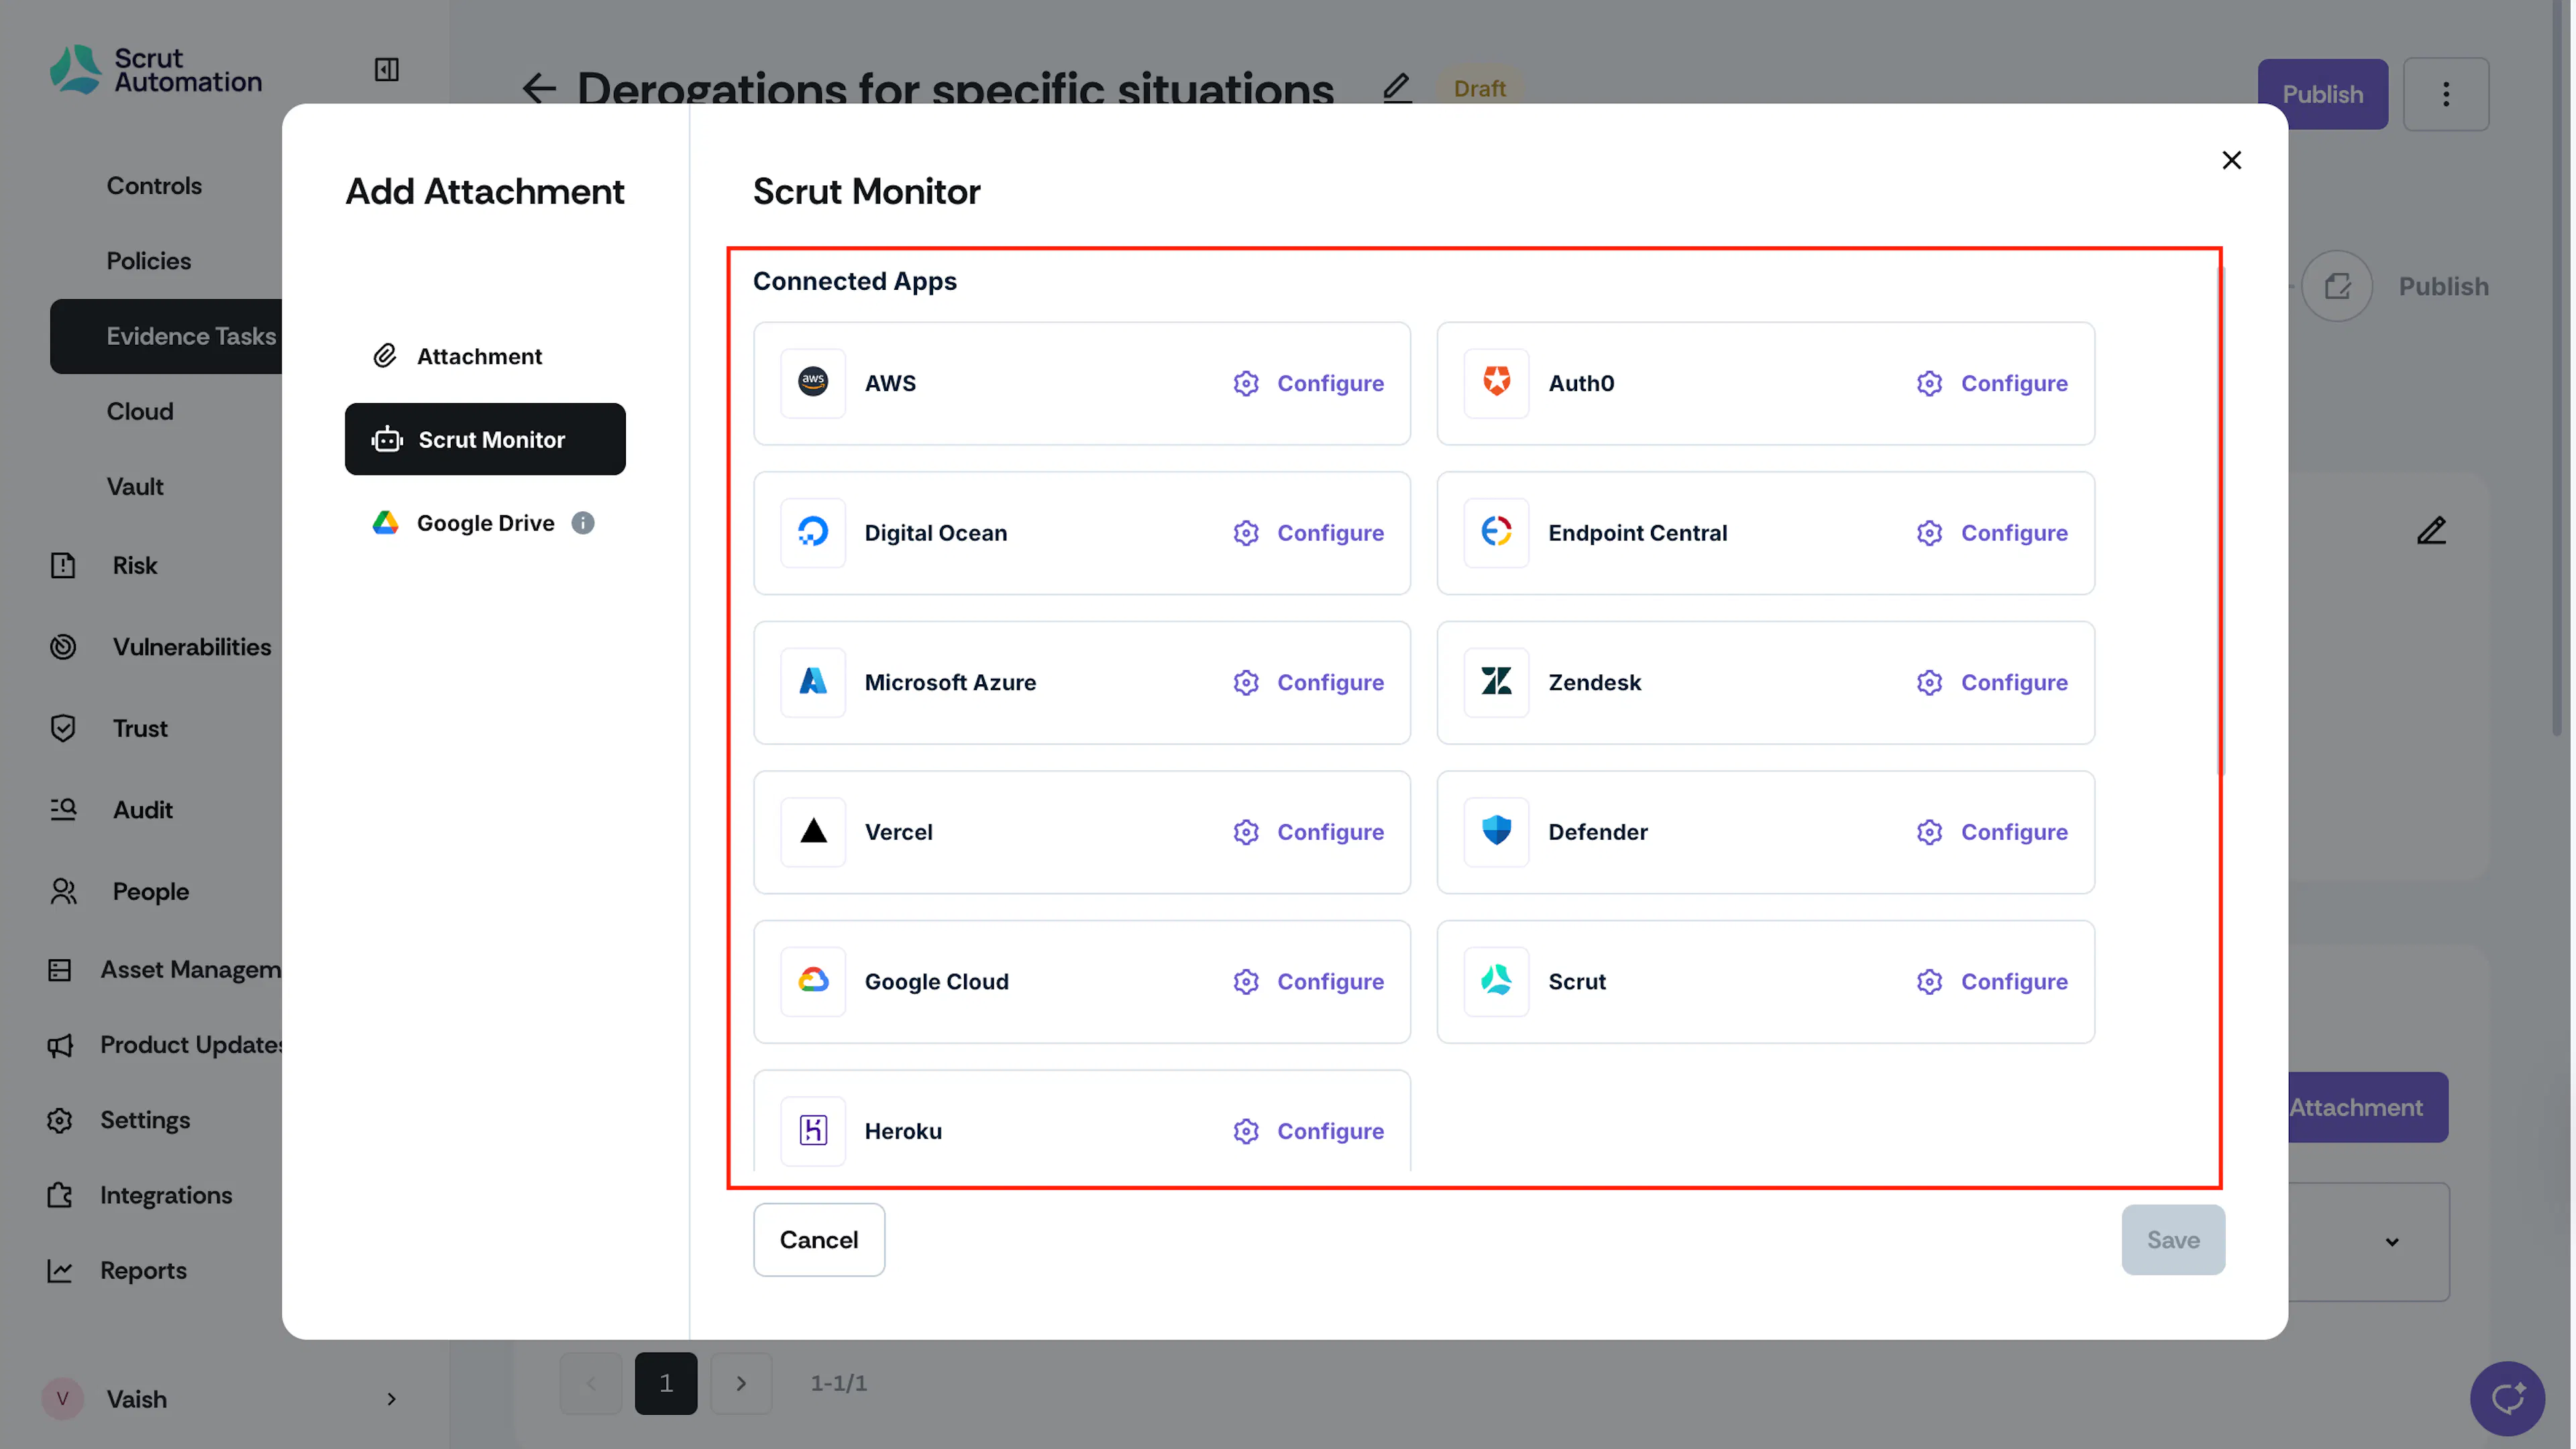
You'll see a list of Connected and Supported Apps.
-
Click the Configure button next to the app you want to use for collecting evidence.
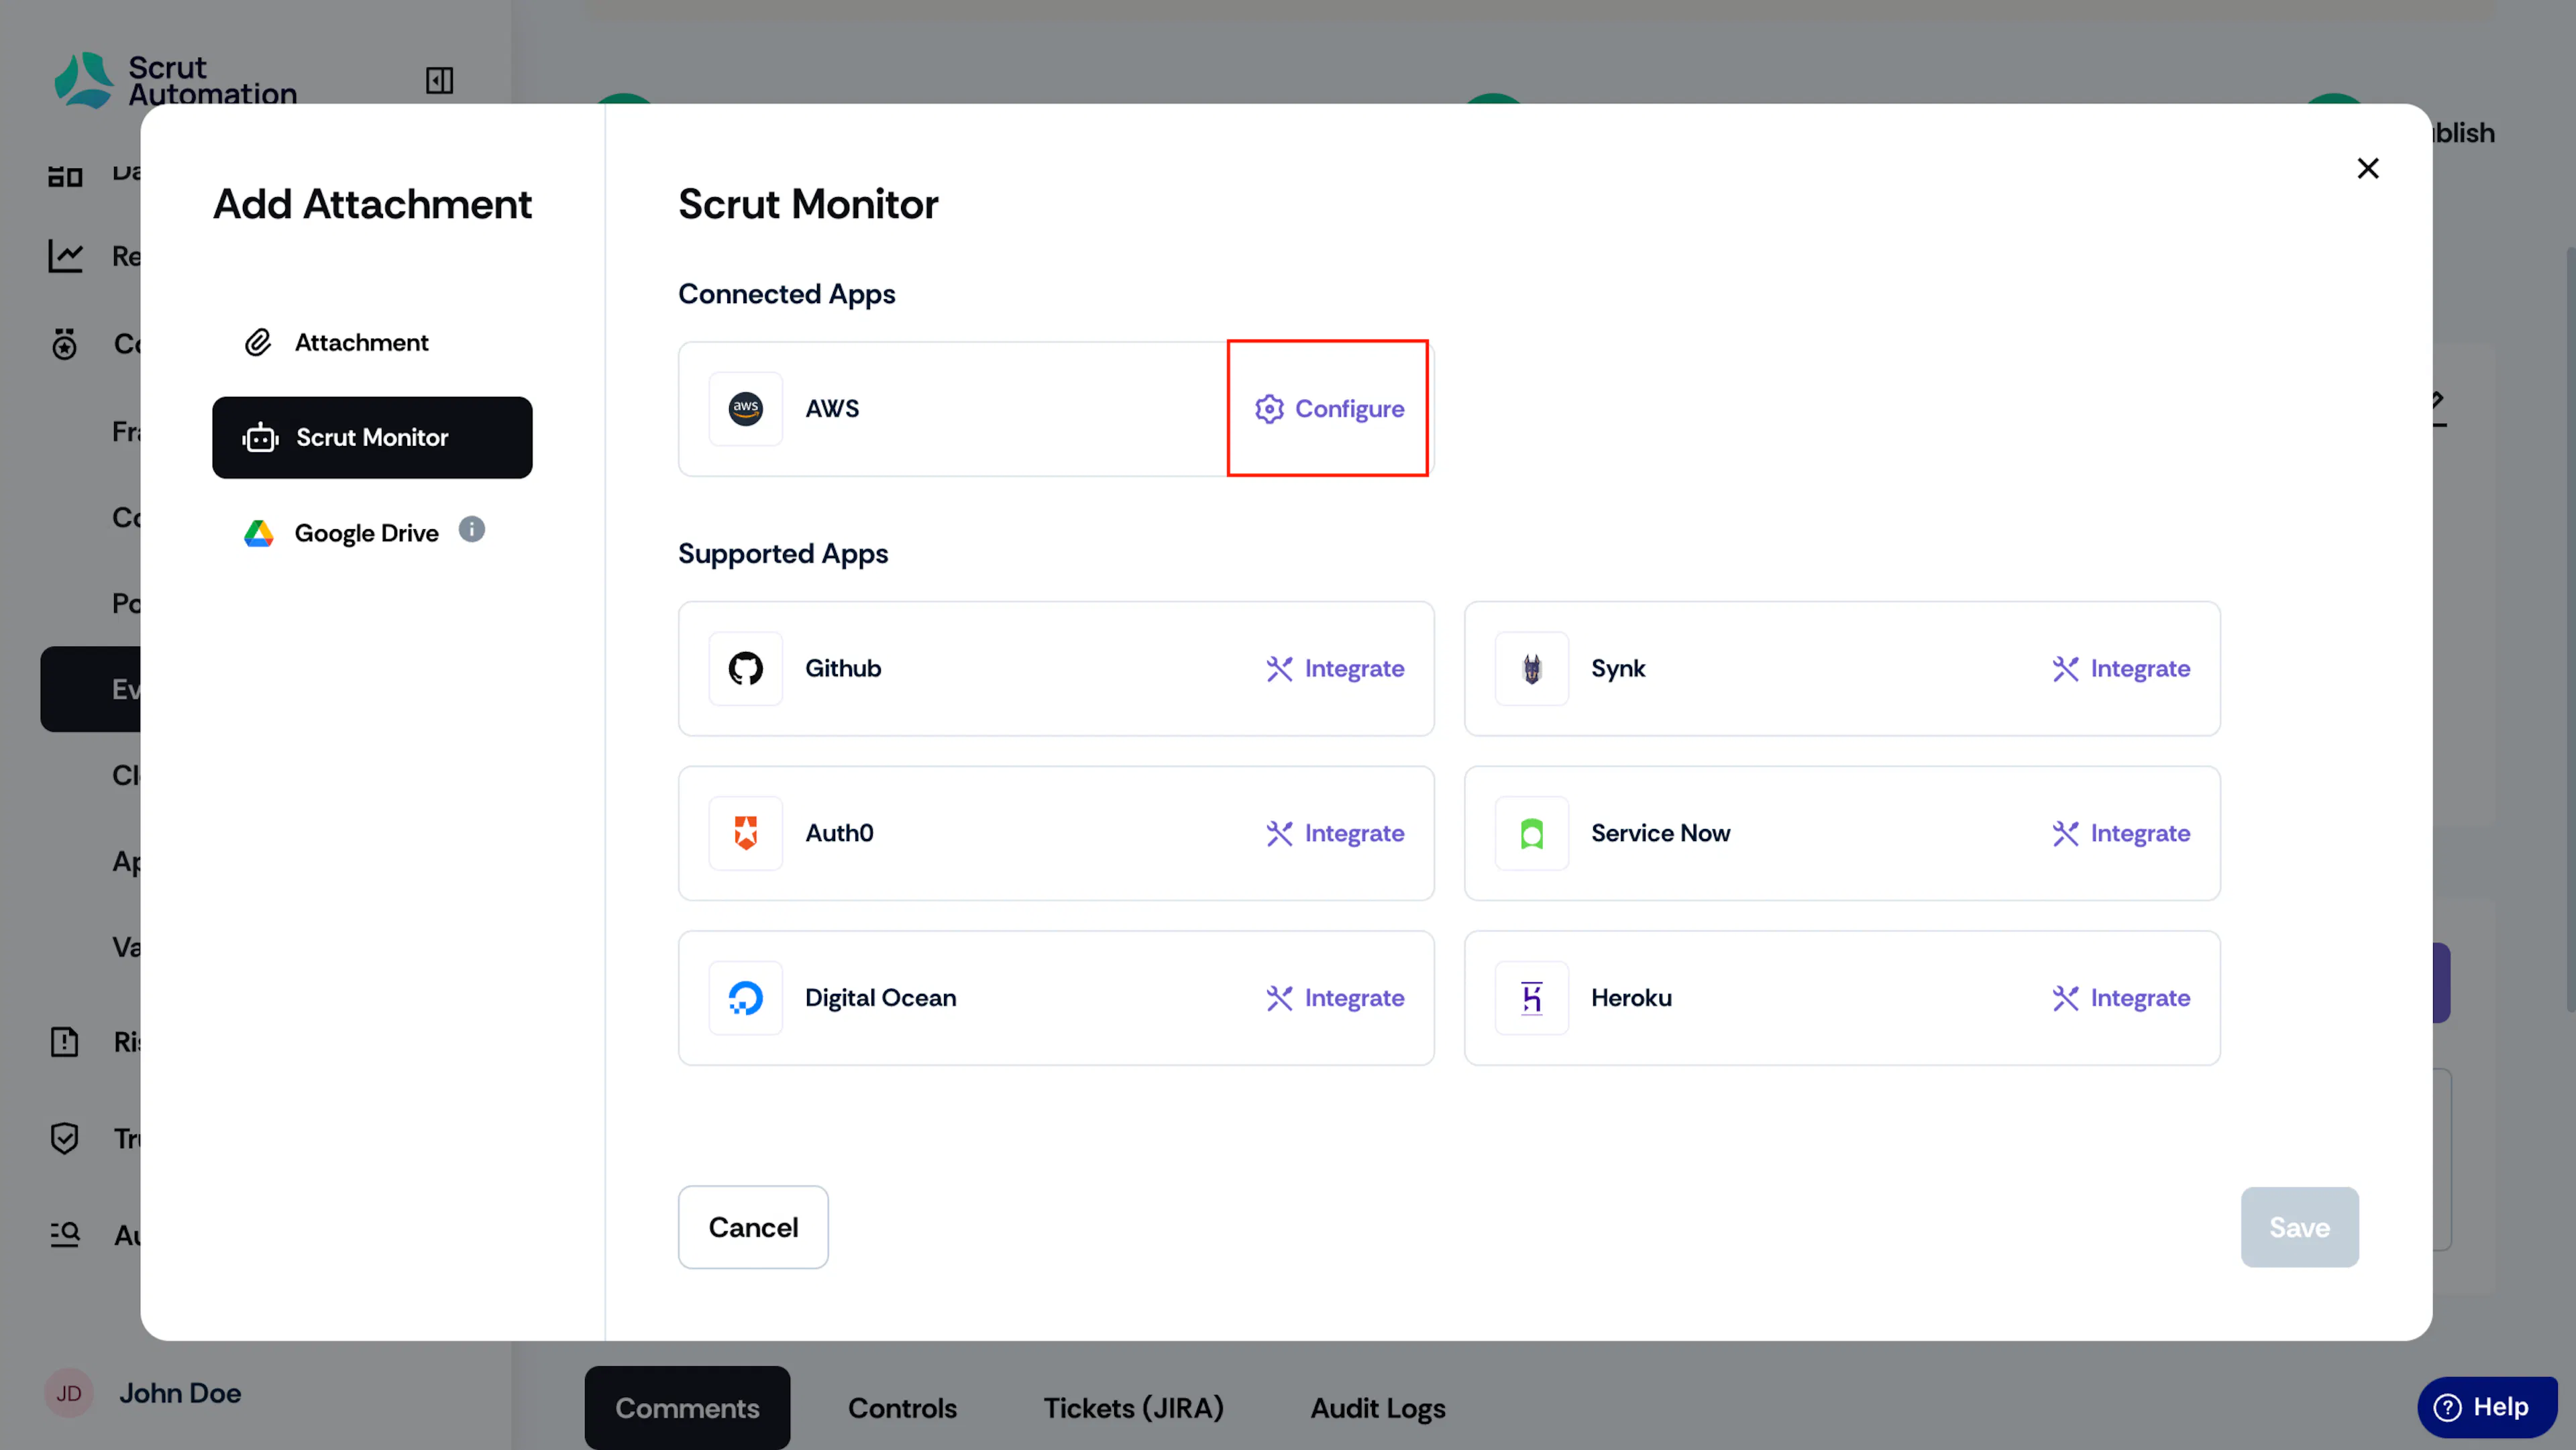
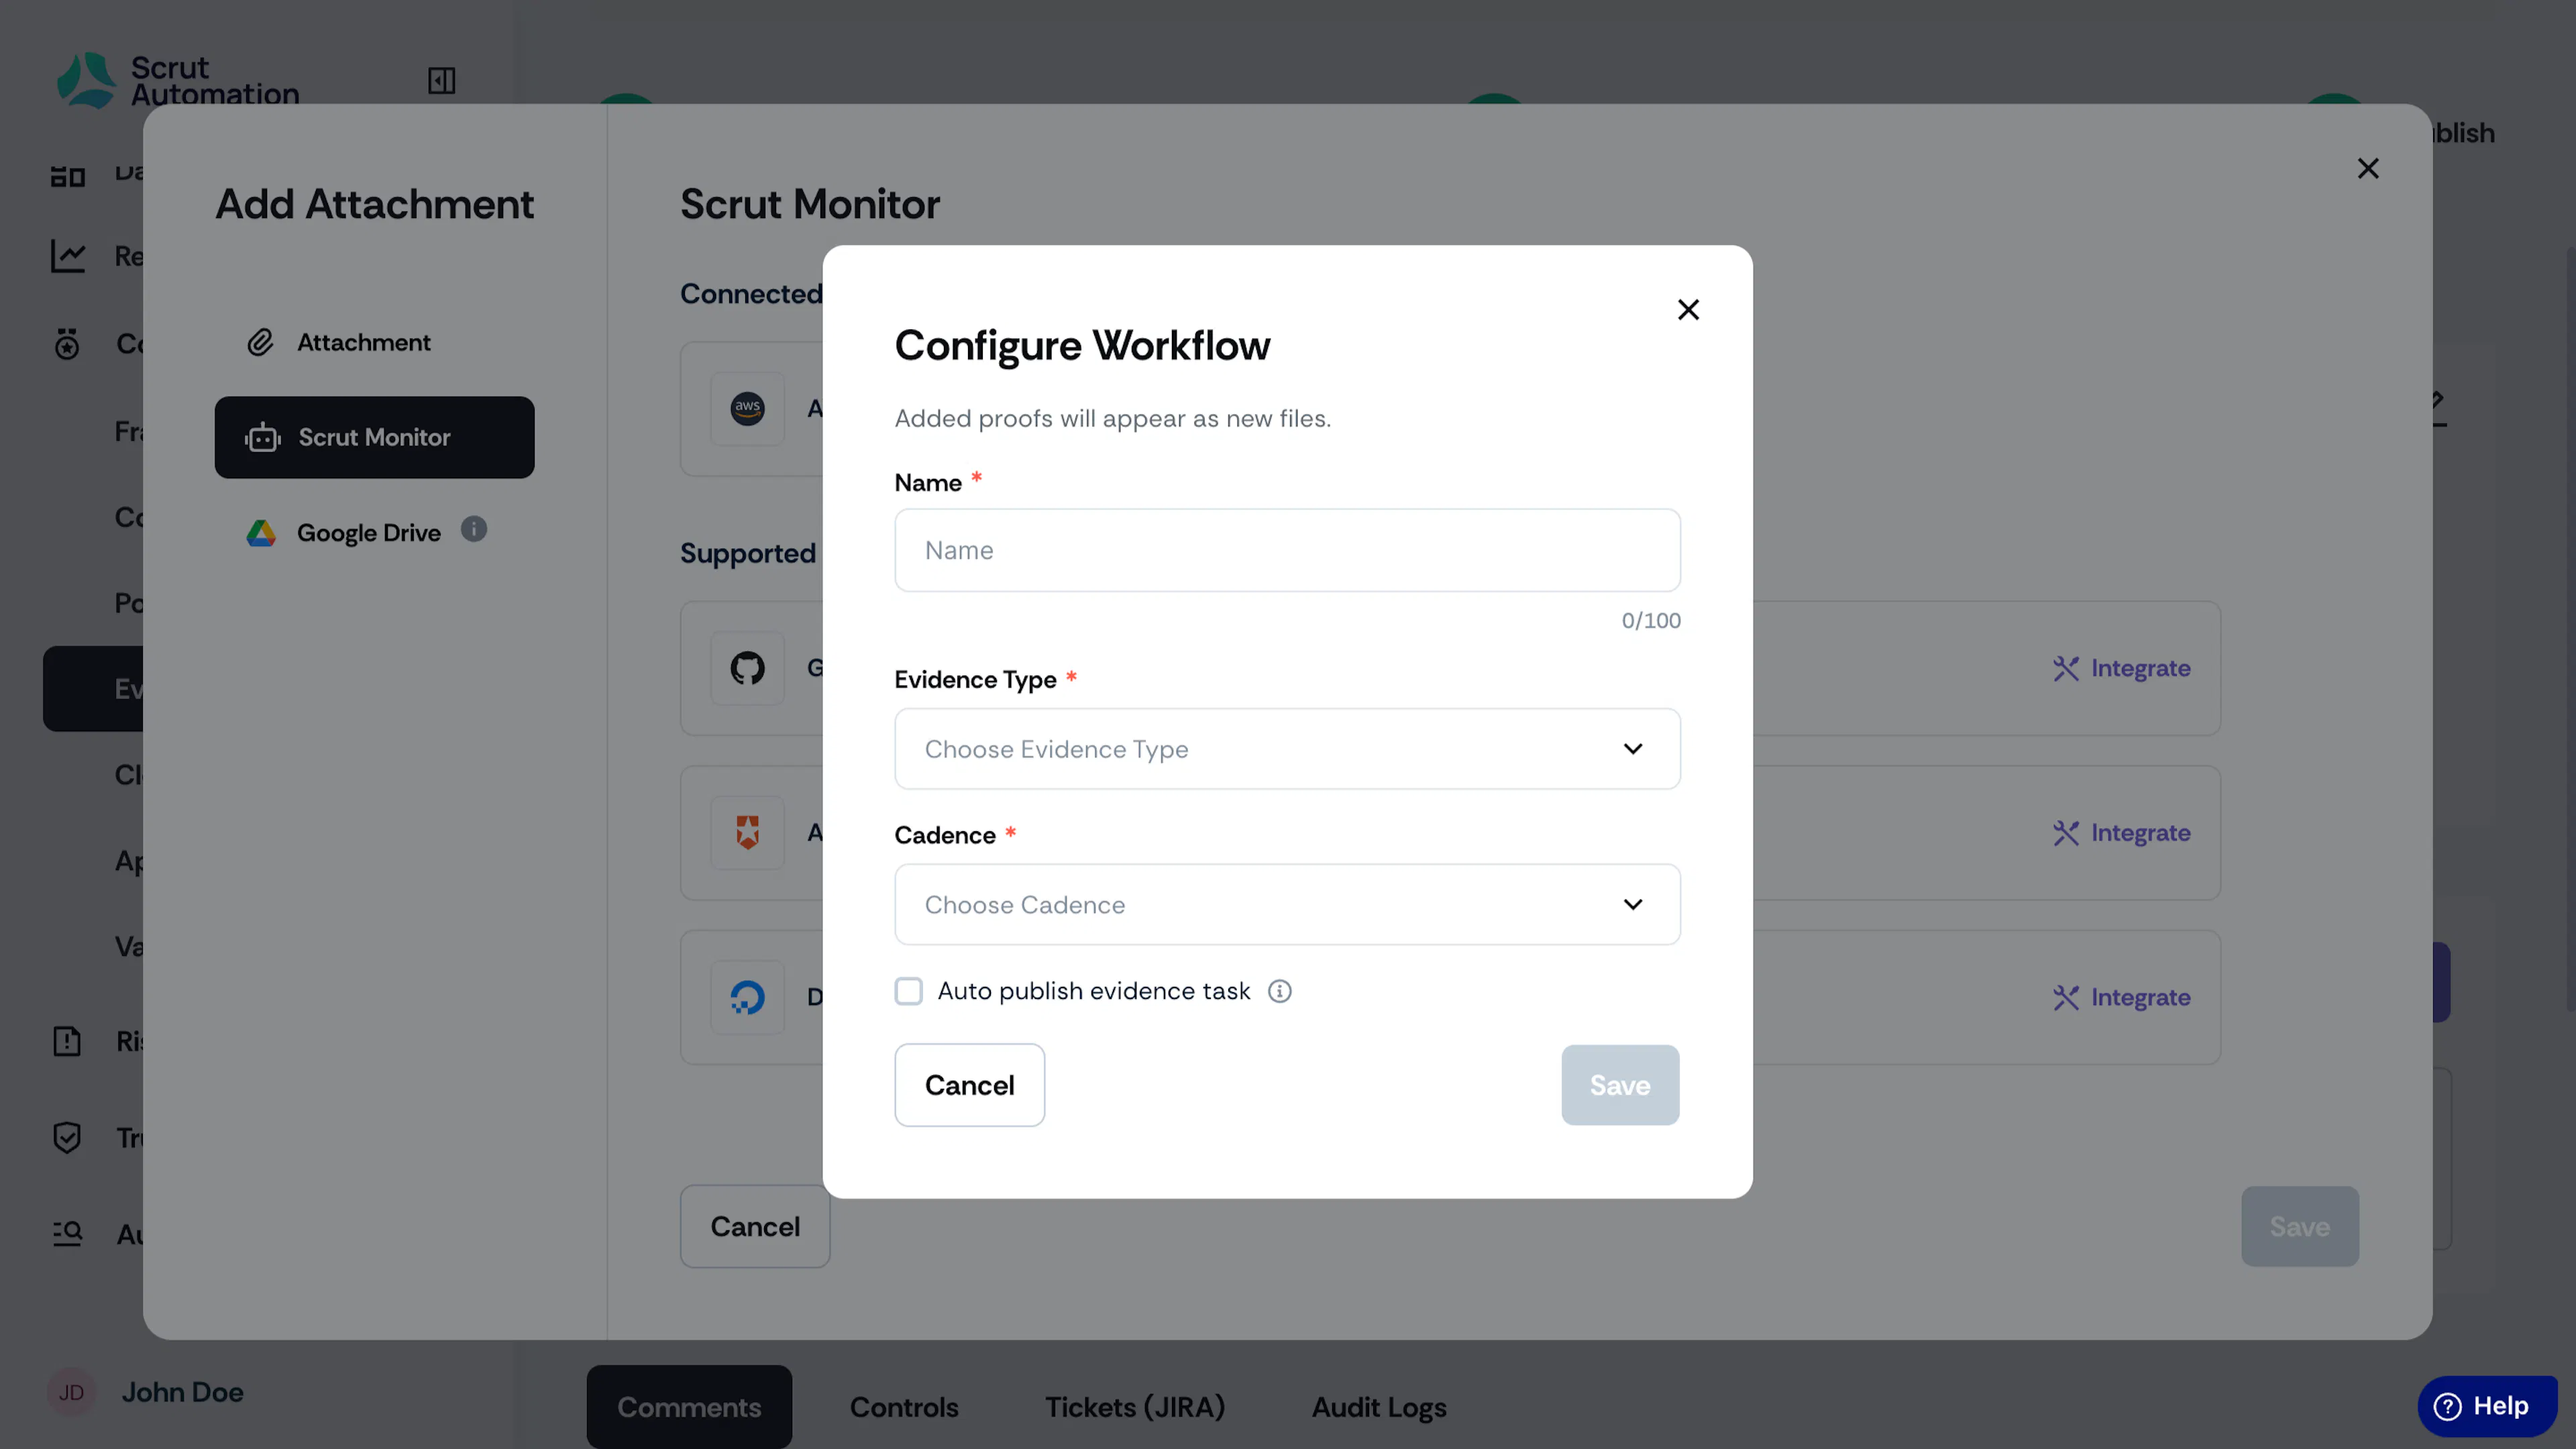
The configure workflow window opens.
-
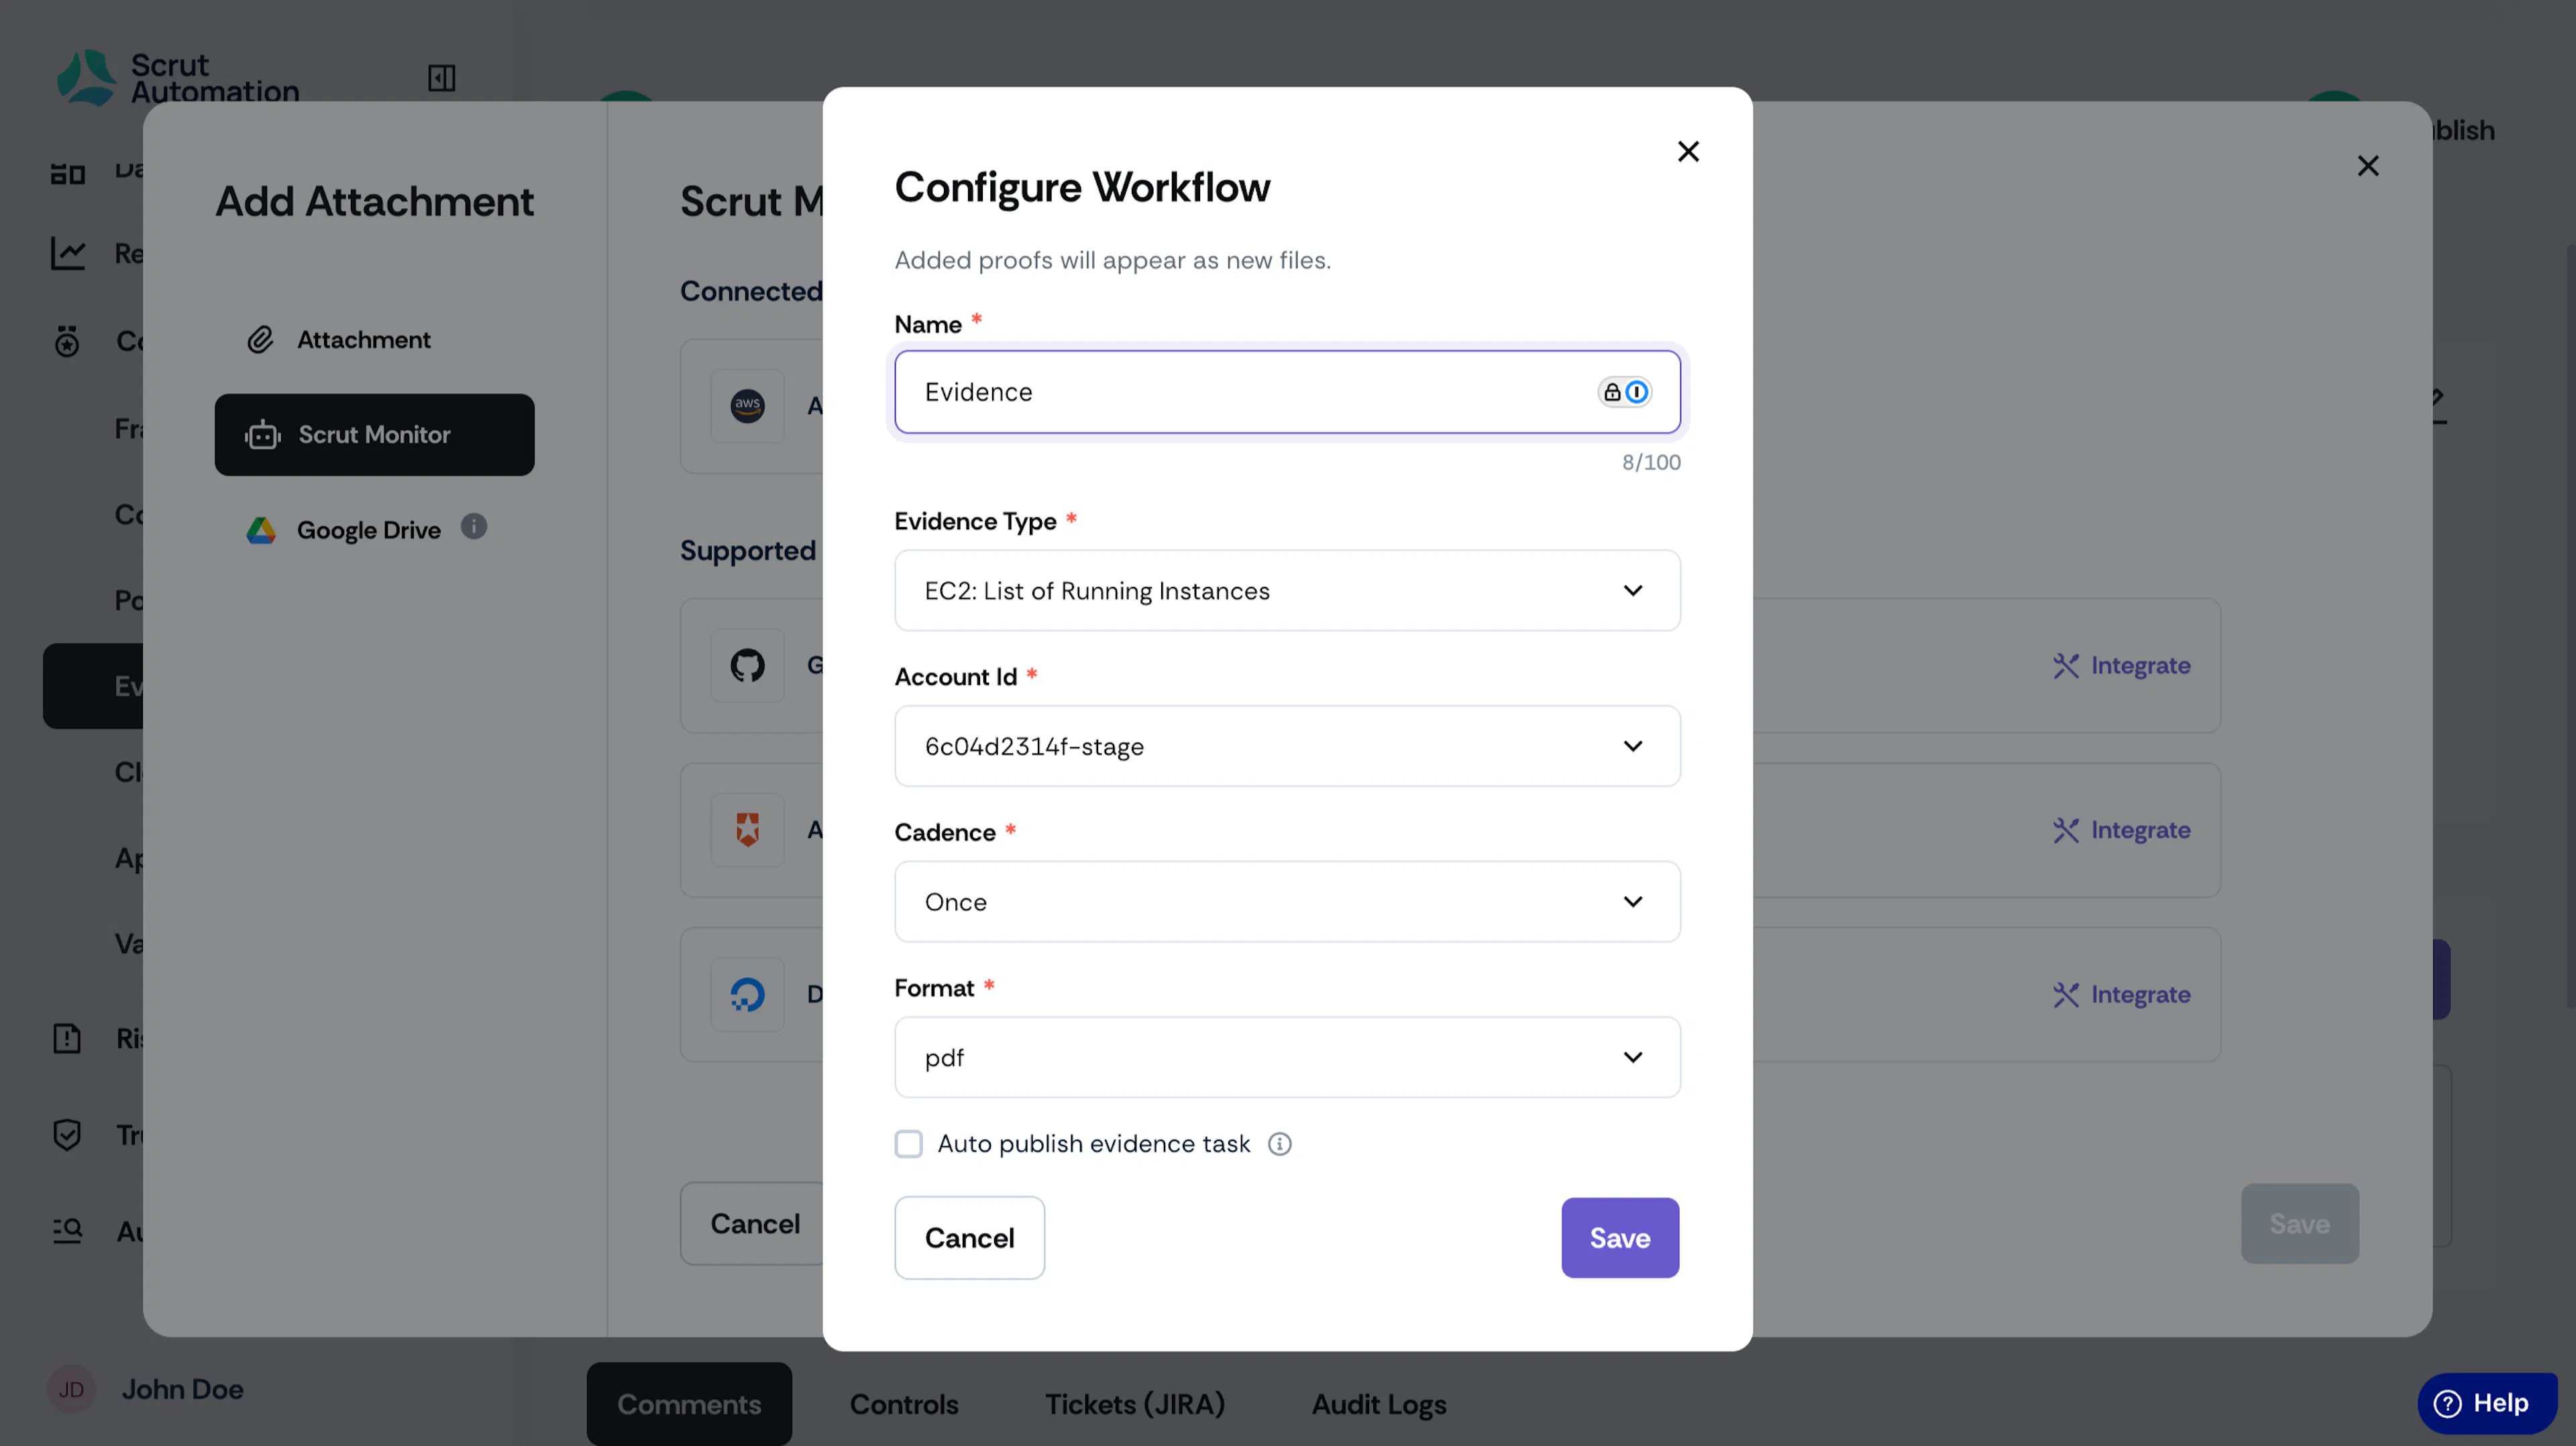
Enter the Evidence Name, Type, and other details as required.
-
Choose the Cadence (how often you want Scrut Monitor to fetch the evidence), select the Evidence Format, and click Save.
Note:
- If auto-publish is enabled, the evidence task will automatically publish on a set schedule when new evidence is attached.
- If disabled, the task status will change to draft when new evidence is attached.
-
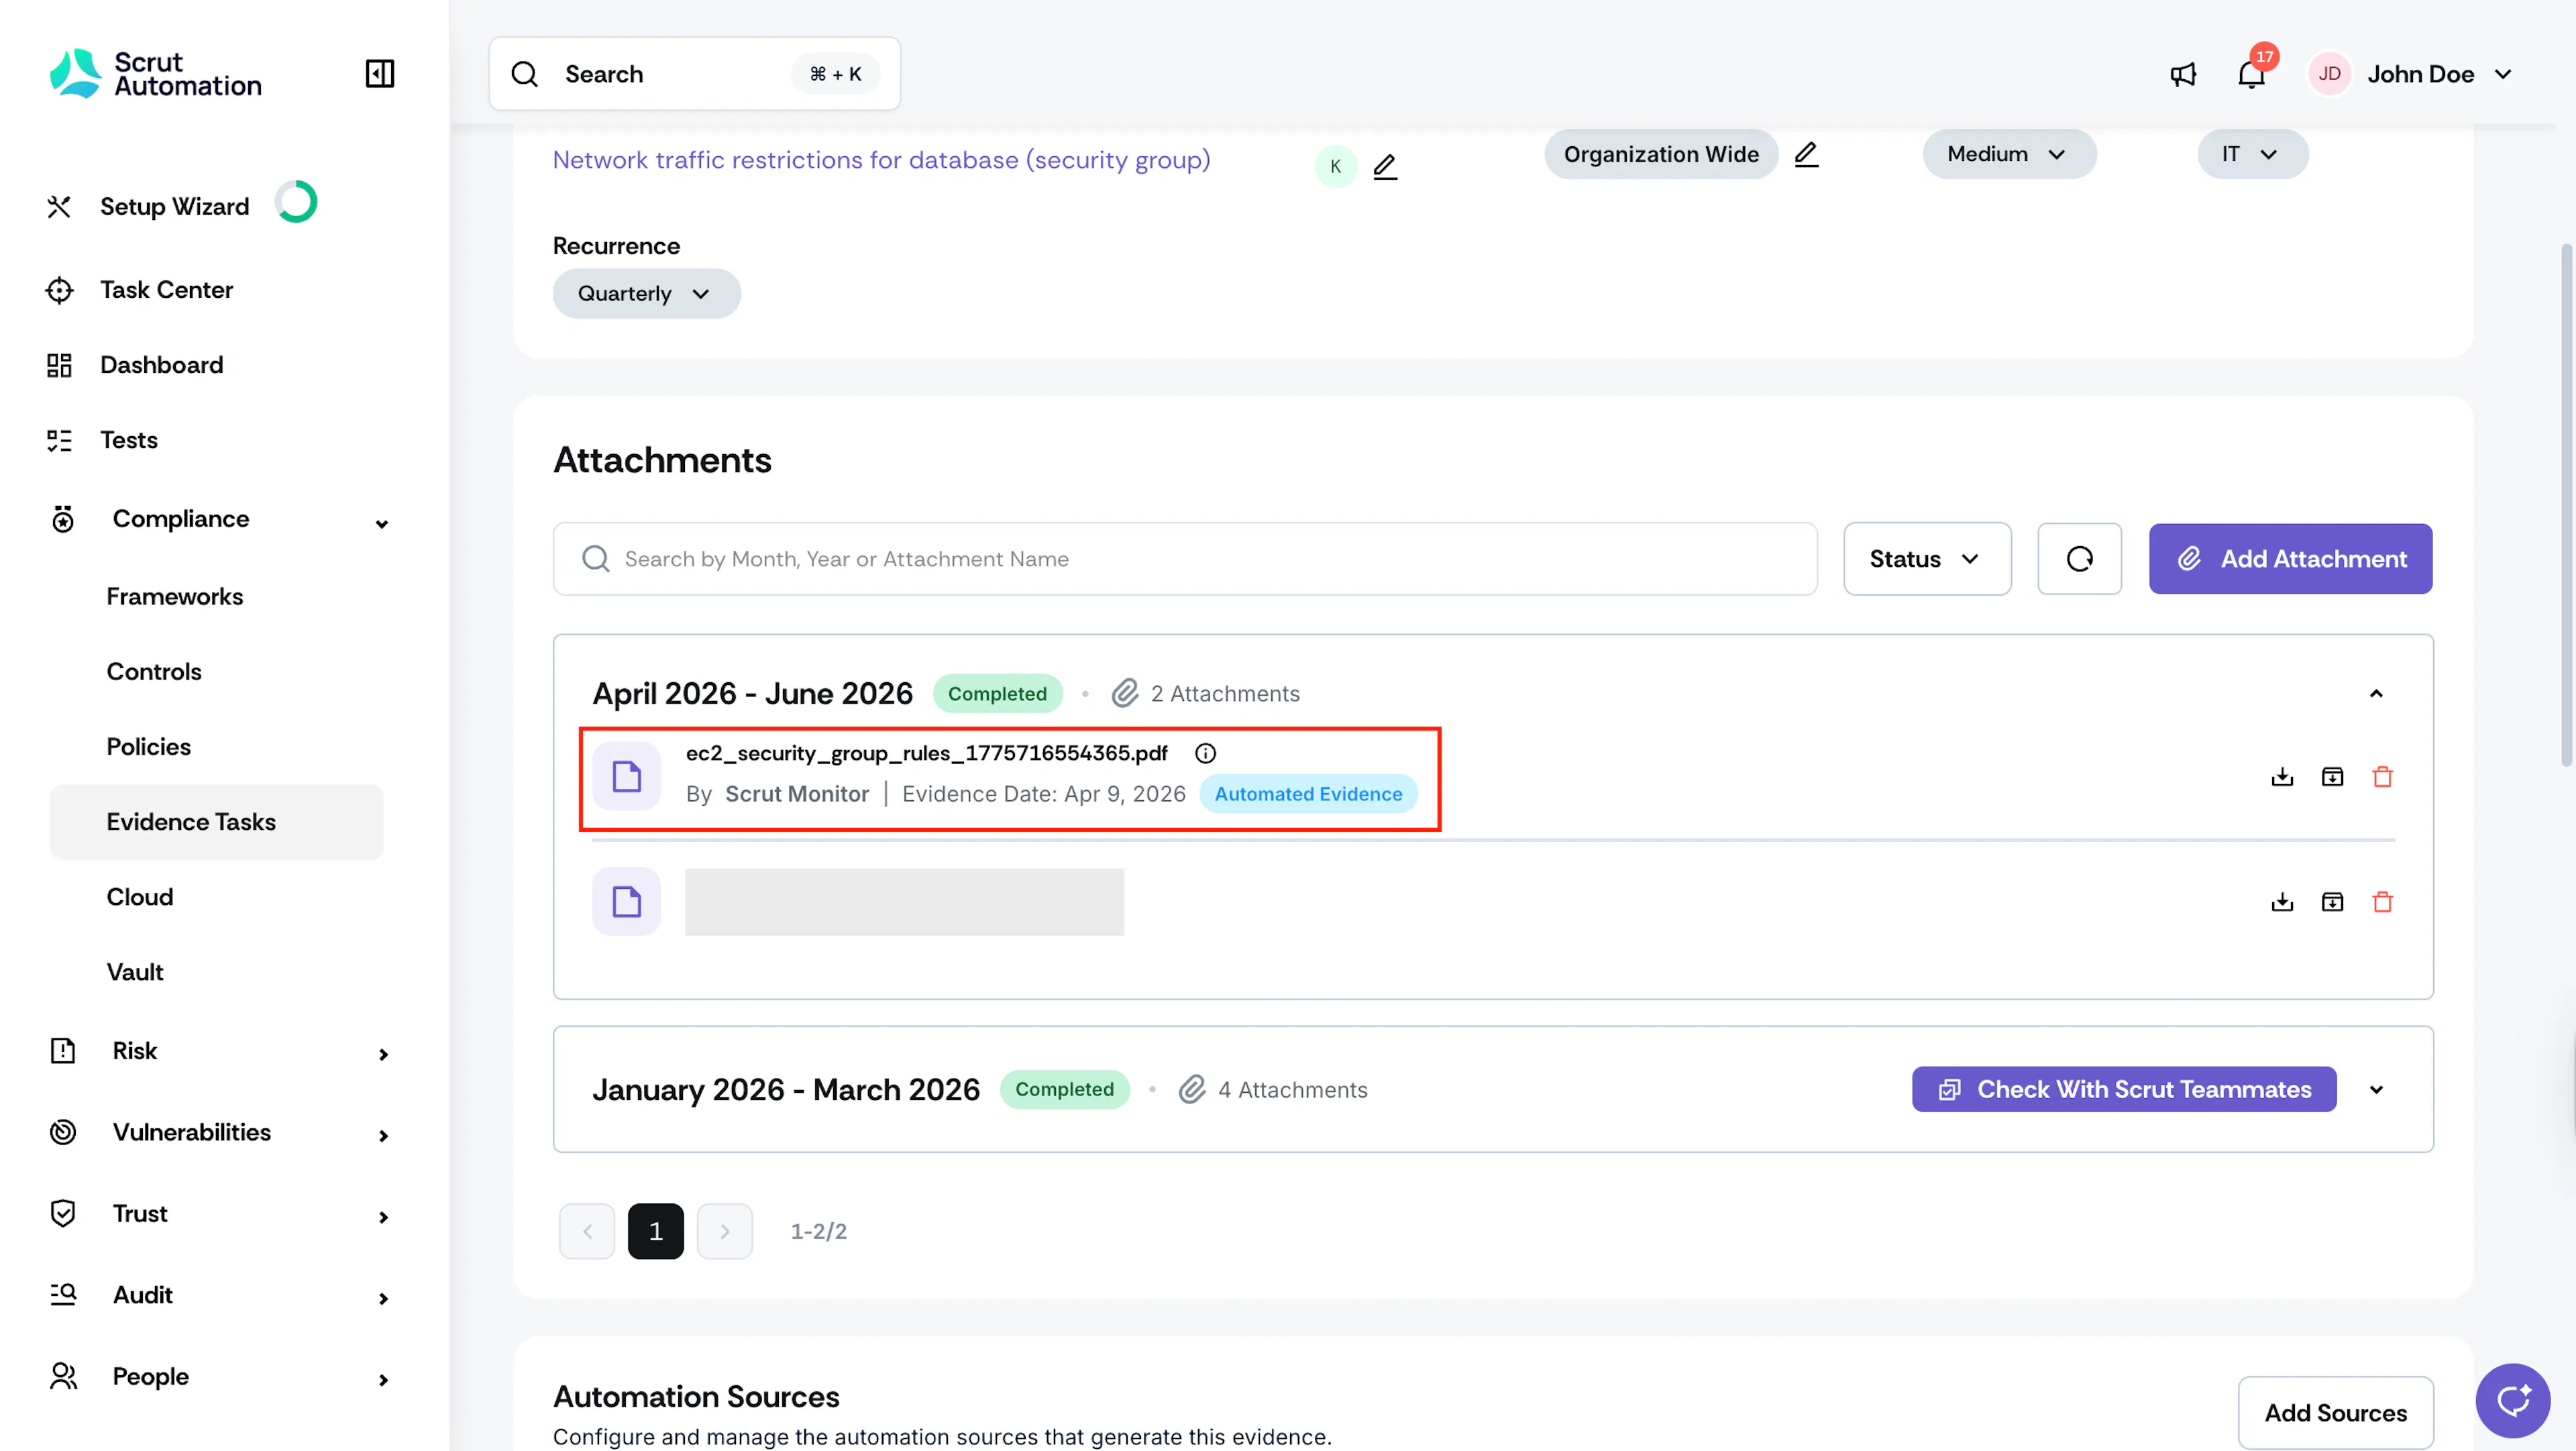
Once configured, Scrut Monitor will be successfully set up and will automatically fetch the required evidence and attach it as per the defined cadence.
Understanding the Scrut Monitor Report
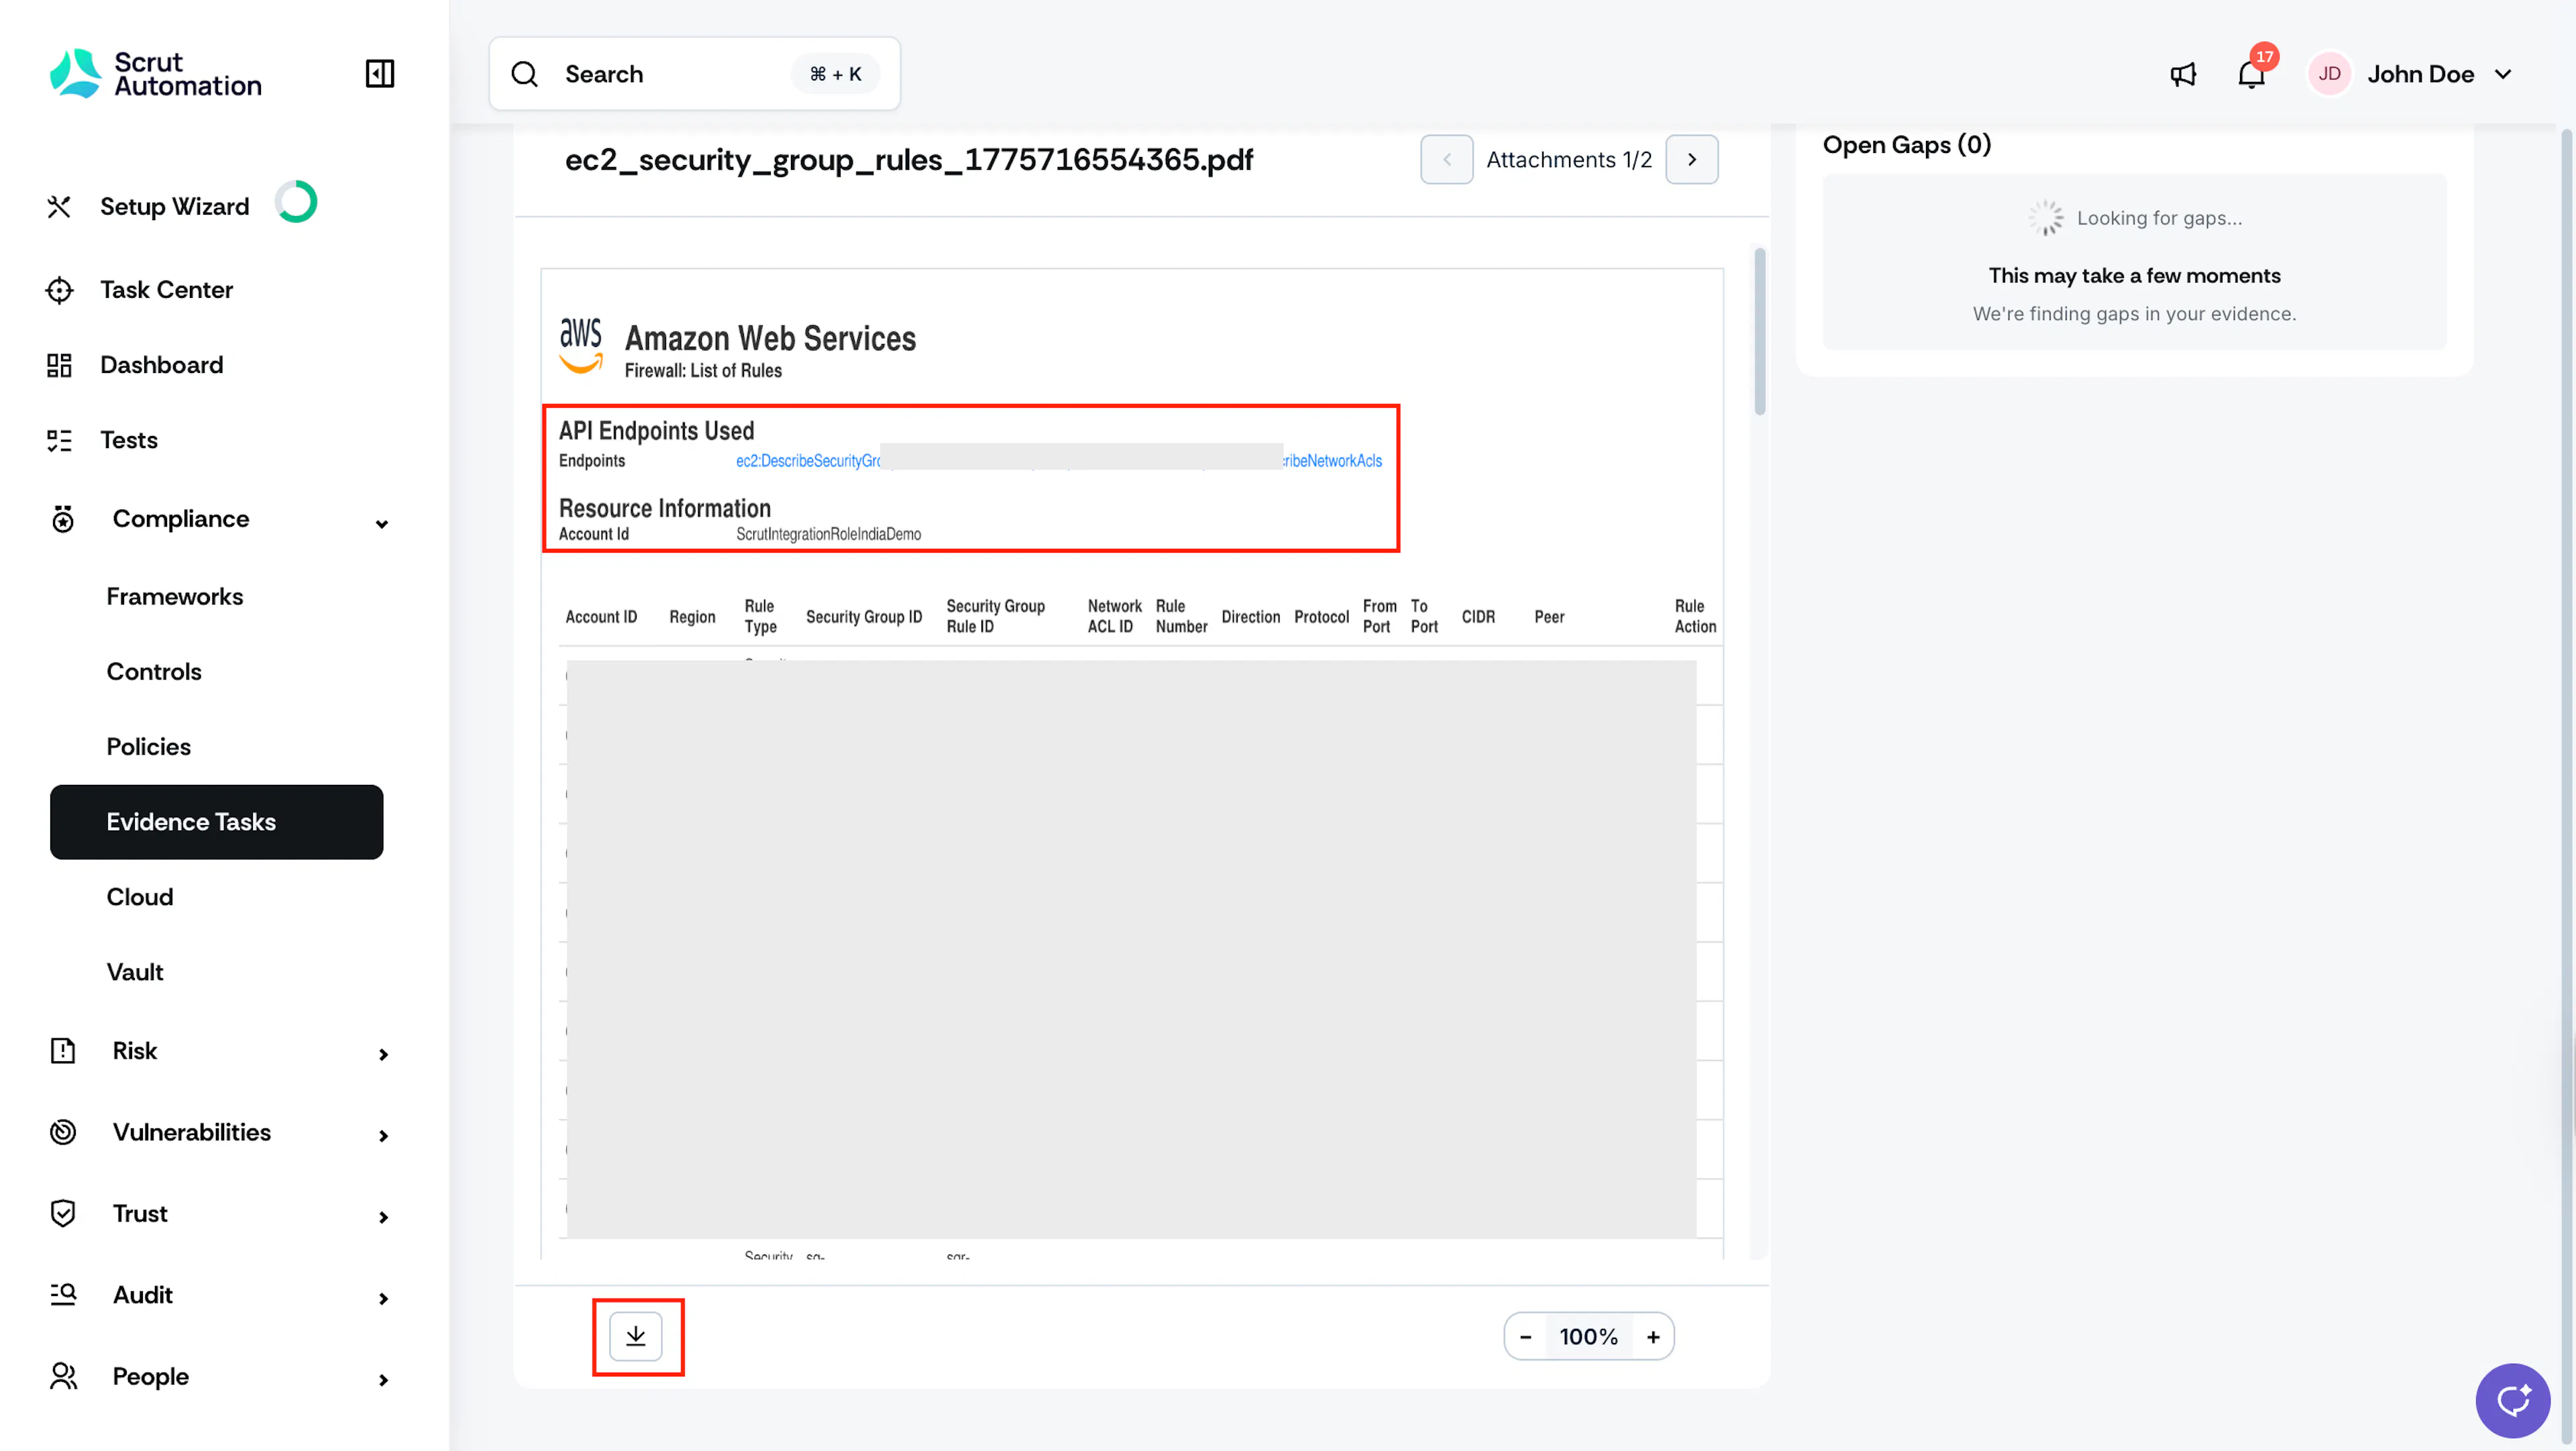
Once Scrut Monitor runs and attaches evidence, you can open the report to see exactly how the data was collected.
Each Scrut Monitor report includes an API Endpoints Used section that lists the specific API calls made to fetch data from your connected integration. For each endpoint, you can access its official documentation directly from the report.
What this section shows:
- The exact API endpoints used to collect the evidence (for example,
iam:ListUsers,iam:ListMFADevices,iam:ListGroupsForUserfor an AWS IAM report) - Clickable links to the integration's official API documentation for each endpoint
Why this matters:
- Auditors and reviewers can independently verify the data source and confirm that the evidence was pulled from the correct APIs
- Removes ambiguity about where compliance data originates
- Makes audit reviews faster and more reliable
To download a report, click the download button in the preview.