
Frameworks: Walkthrough
Who can use this feature
- Supported on Foundation, Growth, and Scale plans
The Framework Dashboard provides a comprehensive overview of all frameworks added to your Scrut account and their compliance ratios, making it easy for you to track your compliance progress.
How To View the Framework Dashboard
- Sign in to Scrut using your login credentials.
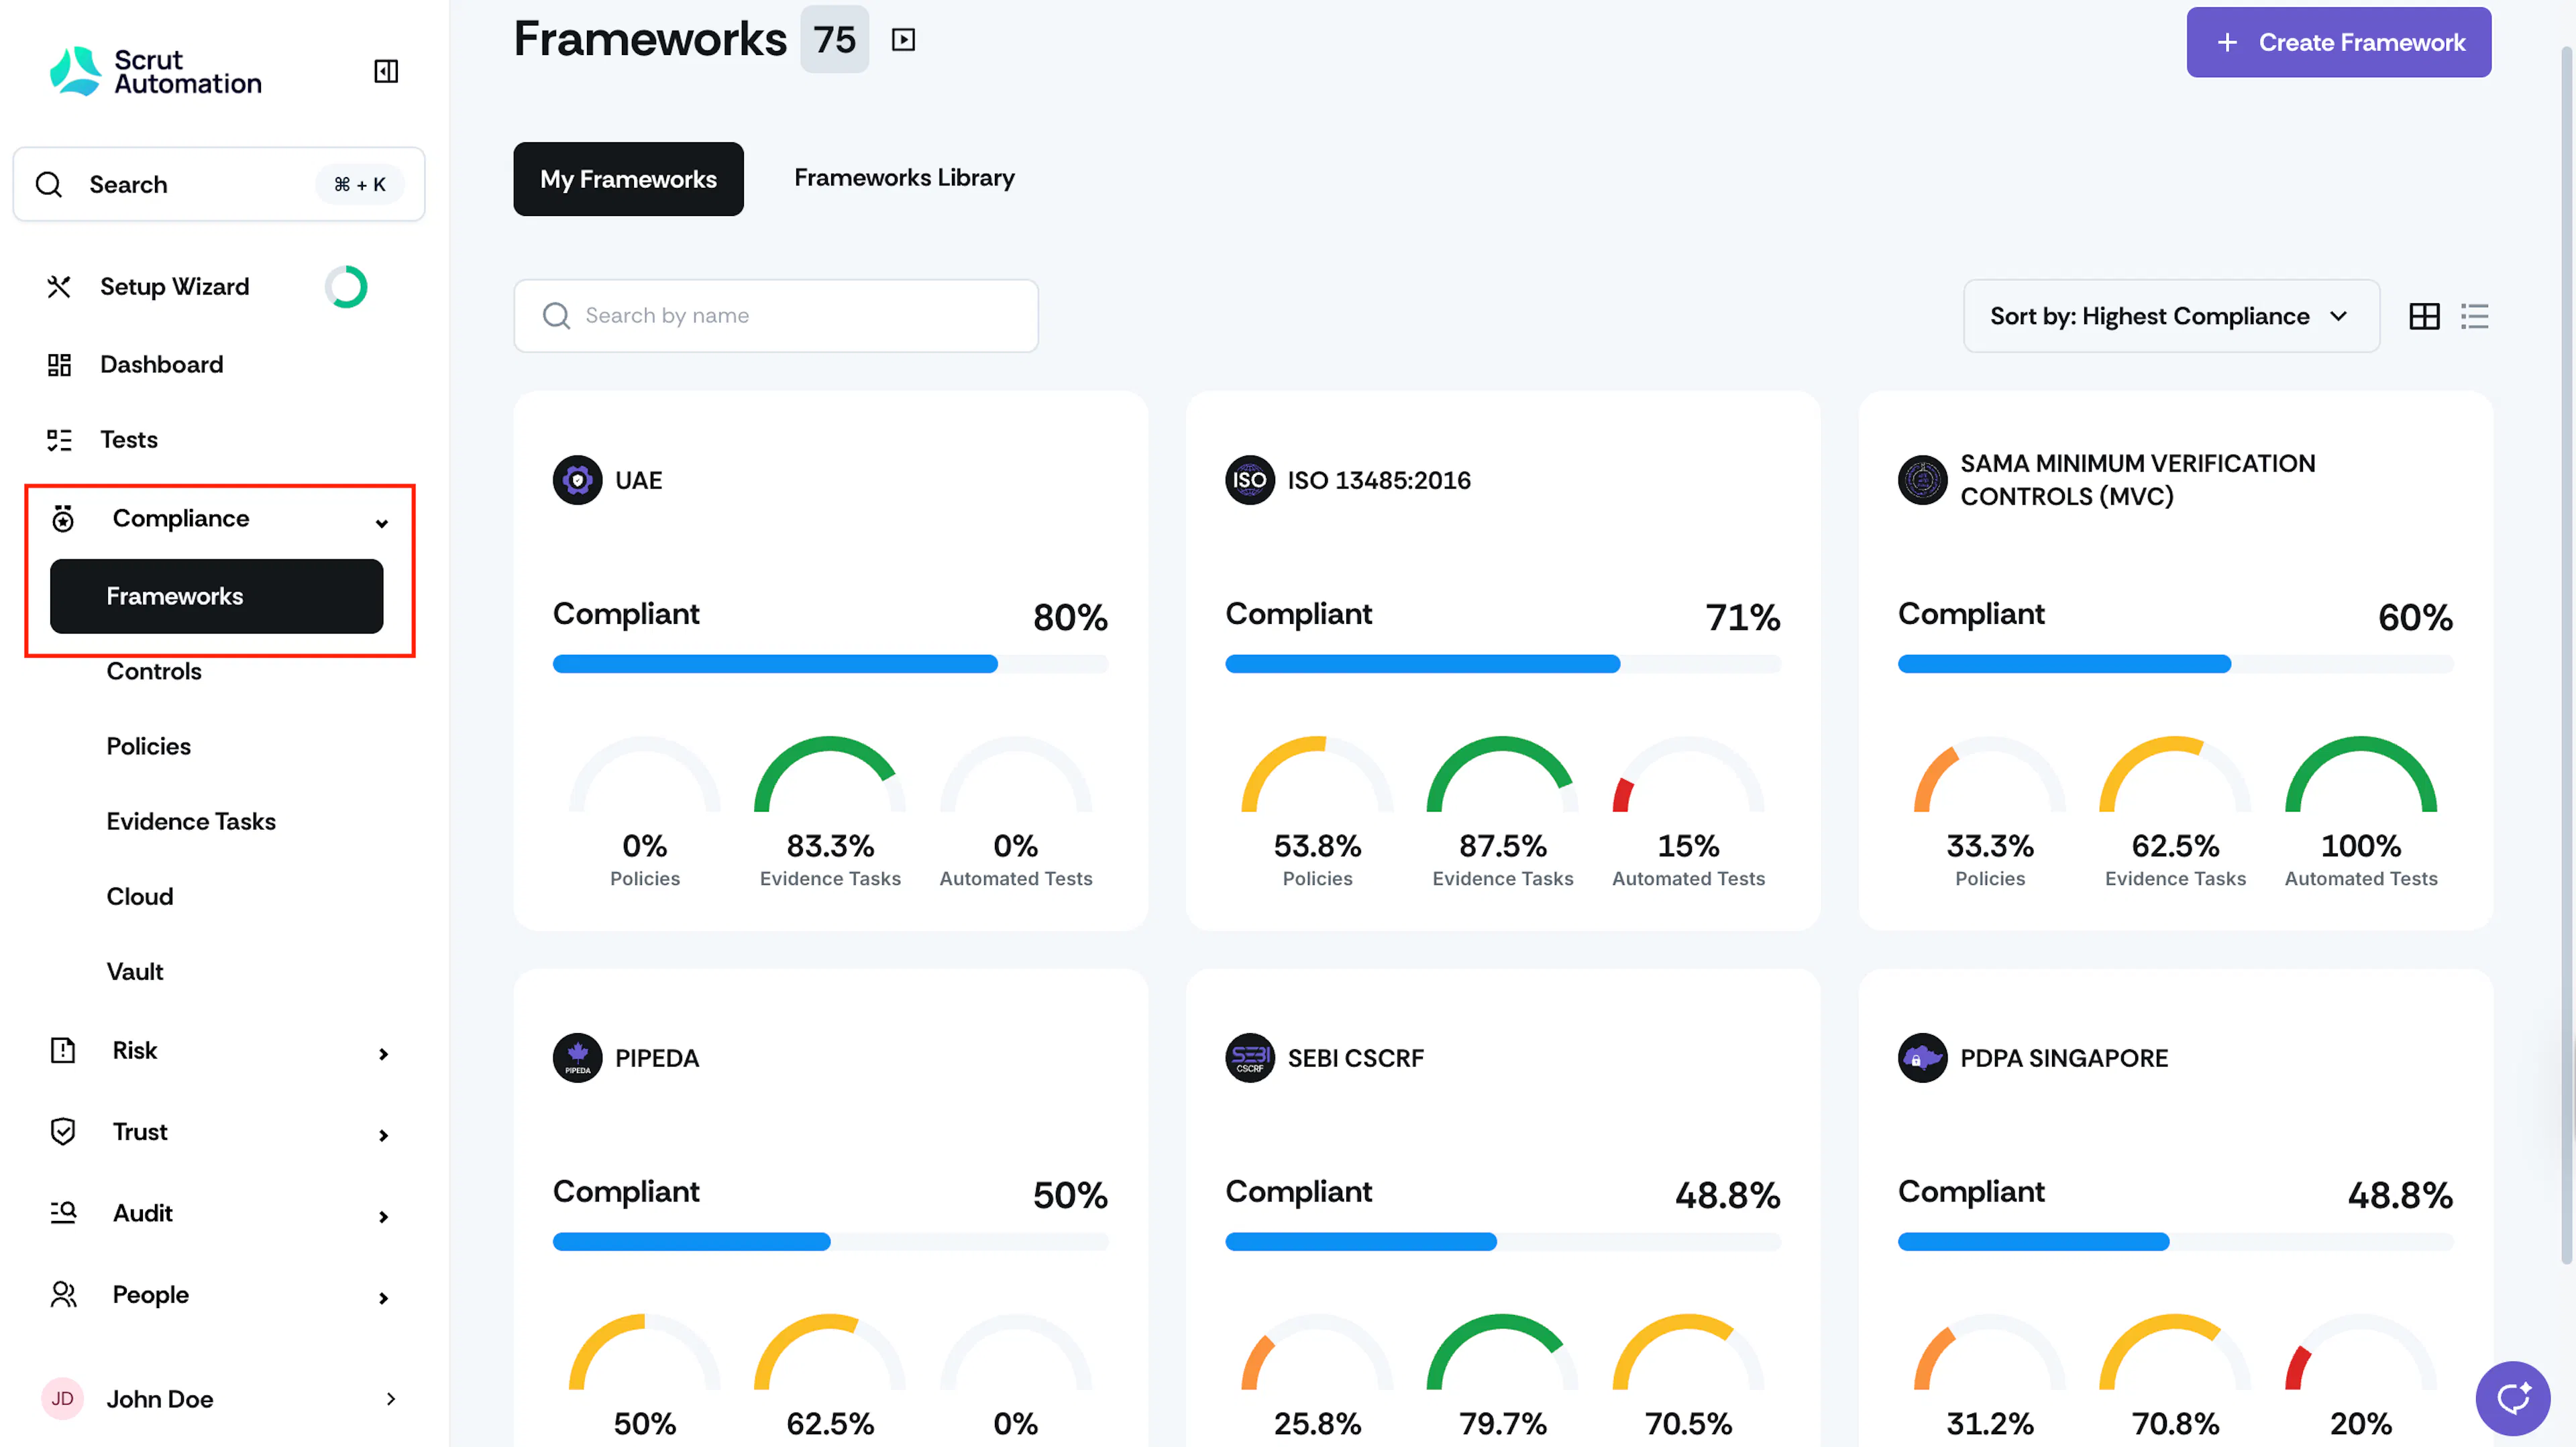
- Expand Compliance and click Frameworks on the left navigation panel.
This brings you to the Framework dashboard, which lists all the frameworks you’re working towards.
My Frameworks Tab
The My Frameworks tab provides an overview of the frameworks added to your Scrut organization. It displays all the frameworks you are working towards or have achieved.
Each framework is presented in a card format, which clearly highlights key information, including the overall compliance readiness status, the compliance percentage of policies, the collected evidence, and the compliance percentage of tests associated with each framework. This makes it easy to assess your progress and focus on areas that need attention.
Framework Cards
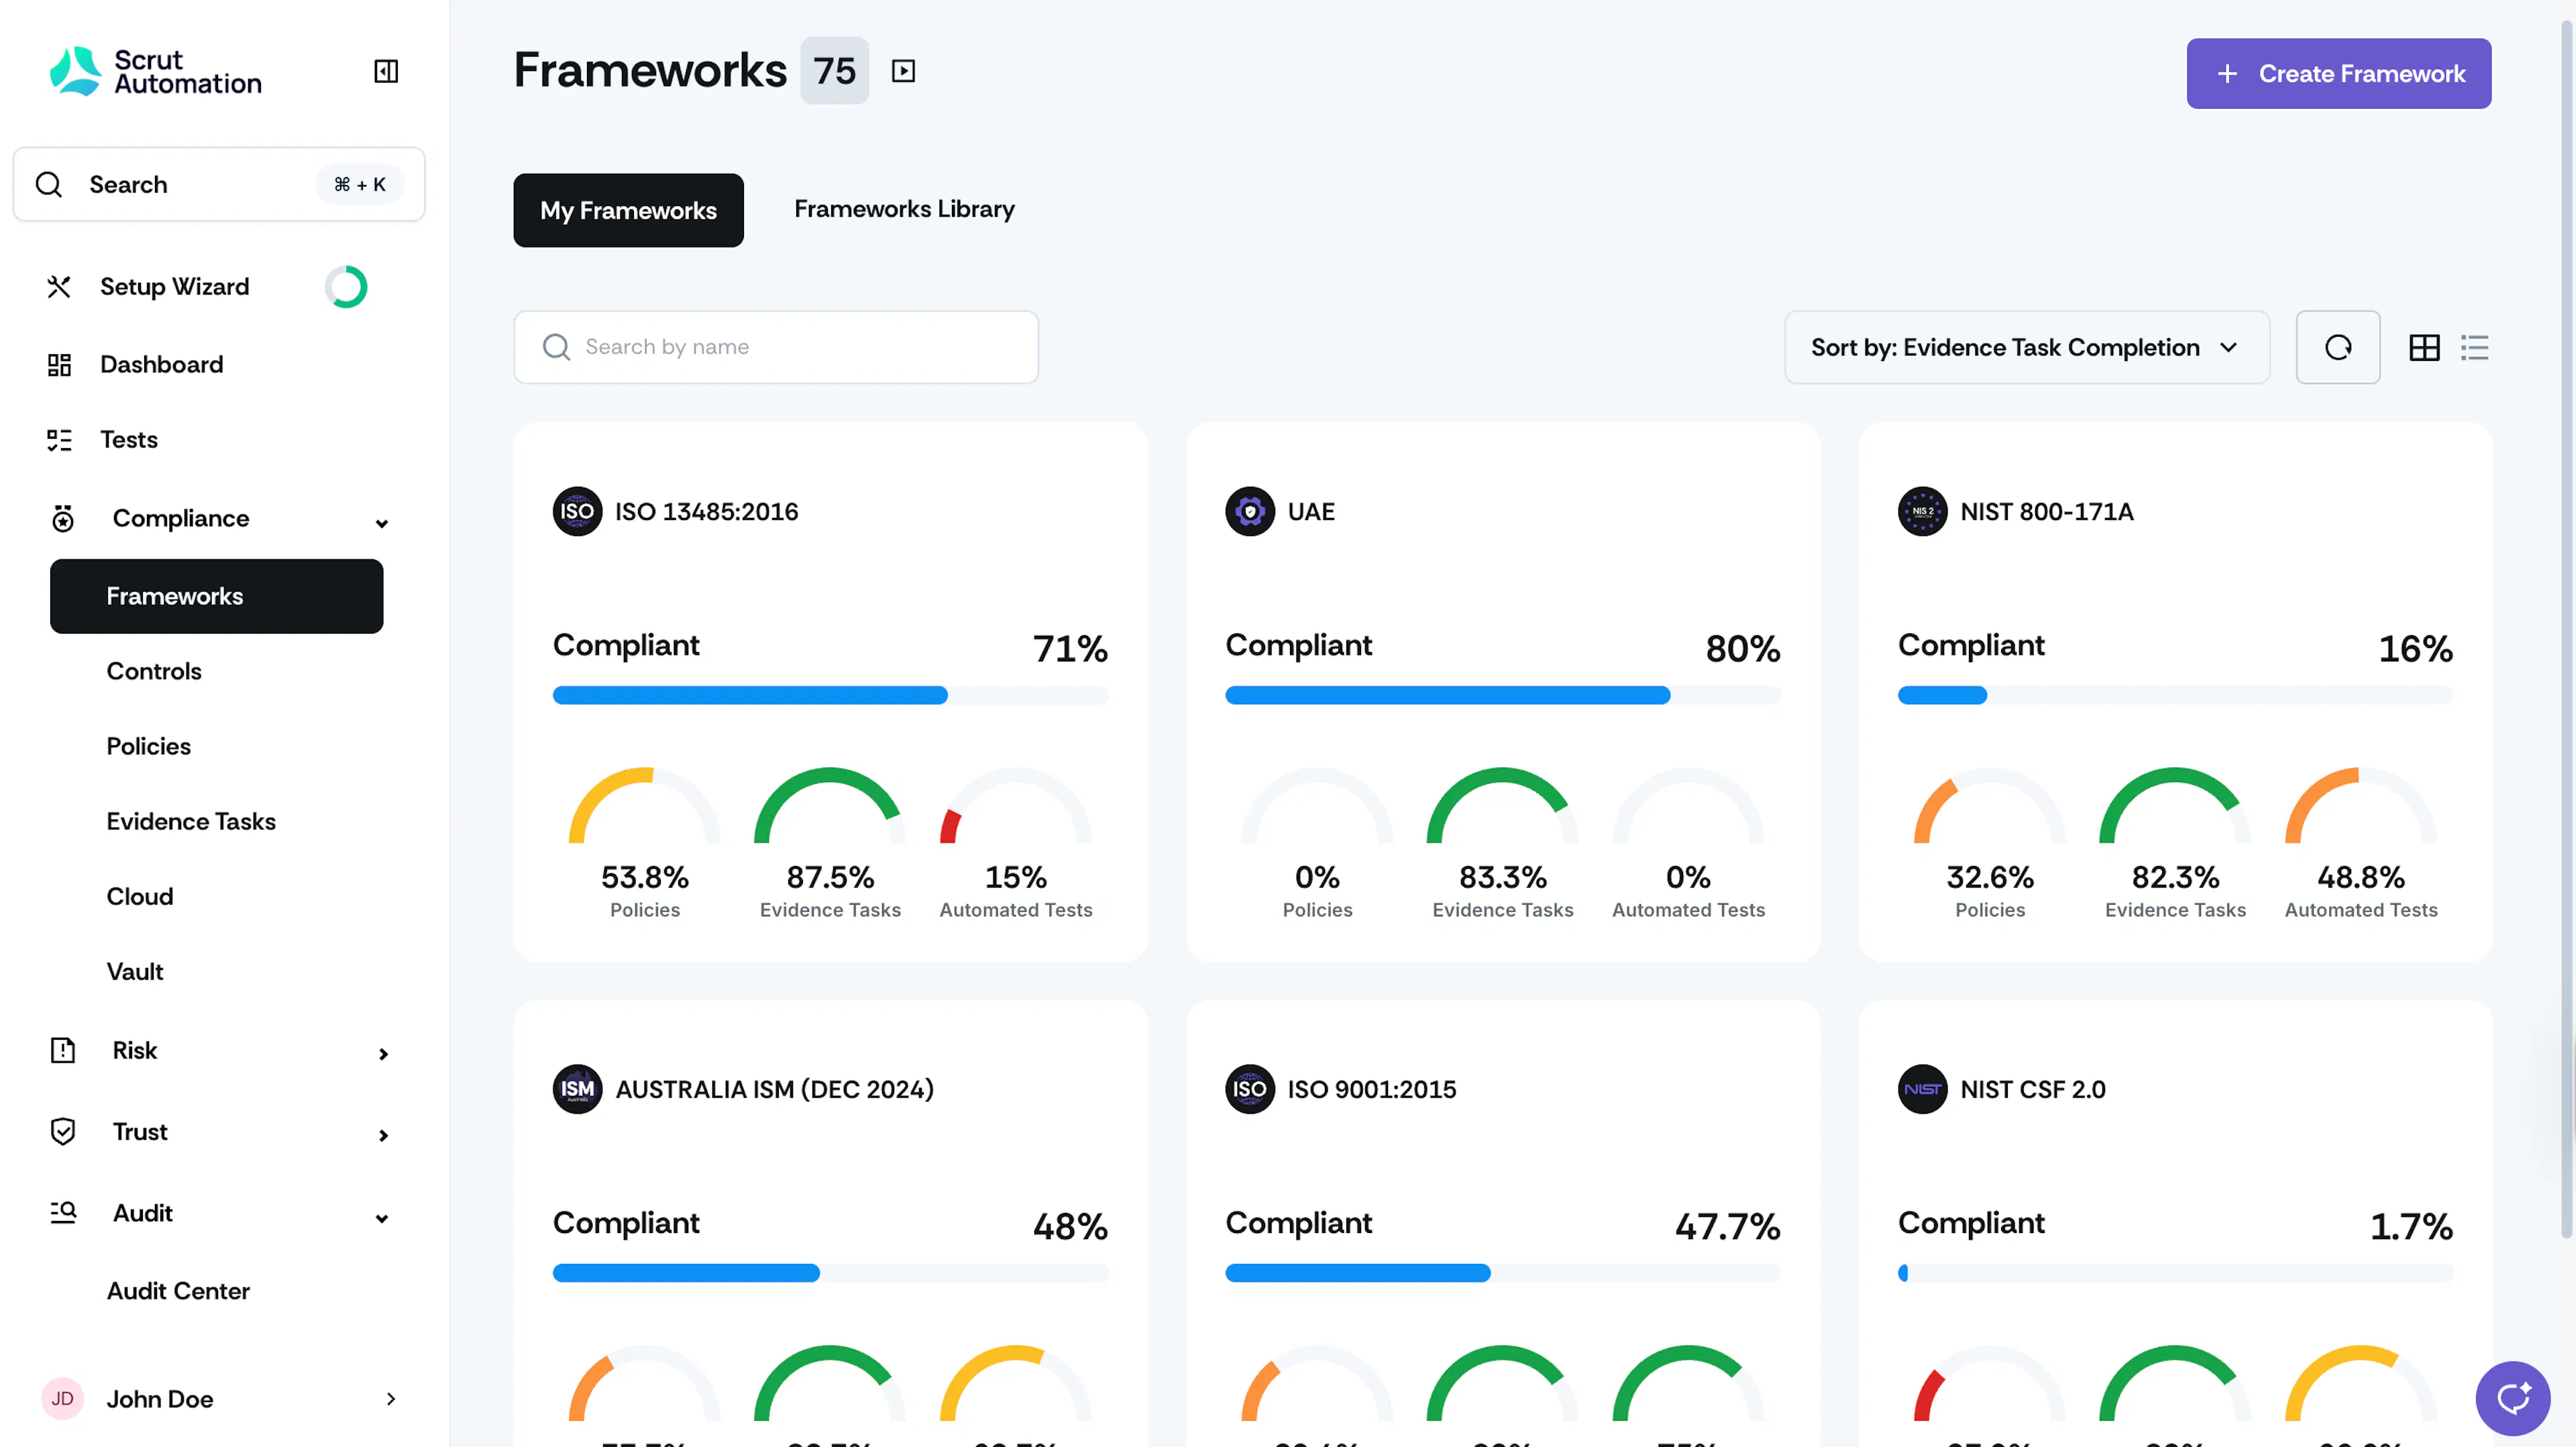
Each card on the Framework Dashboard represents a specific compliance framework and provides a snapshot of its current status. Let's explore its key components:
-
Framework Name: The name of the compliance framework is prominently displayed at the top of the card, making it easy to identify at a glance.
-
Compliance Progress: This metric indicates the overall readiness of your organization concerning the specific compliance framework. The higher the percentage, the more compliant your organisation is with the framework requirements.
Compliance Progress = (No. of controls compliant / Total no. of controls) * 100
Note: Controls which are 'Not in Scope' or 'Not Applicable' are excluded in above formula.
-
Policy: This metric indicates the percentage of policies that have been published for the particular framework. It reflects the completeness of your organization's policy documentation in relation to the framework's requirements. The higher the percentage, the more comprehensive your policy documentation is.
Policy Published = (No. of policies published / Total no. of policies) * 100
Note: Policies which are marked as 'Not Relevant' are excluded in the above formula.
-
Evidence: This metric indicates the percentage of evidence that has been uploaded to support compliance with the framework. It signifies the extent to which your organization has provided proof of documentation of implementing necessary controls and measures.
Evidence Uploaded = (No. of evidences uploaded / Total no. of evidences) * 100
Note: Evidences which are marked as 'Not Relevant' are excluded in above formula.
-
Test: This metric indicates the percentage of cloud test findings that are compliant. It signifies the extent to which your cloud is secure and compliant as per the CIS Benchmark and other standards.
Test Compliant = (No. of tests compliant / Total no. of tests) * 100
Note: Tests which are 'Ignored' are excluded.
Sorting Frameworks based on Filters
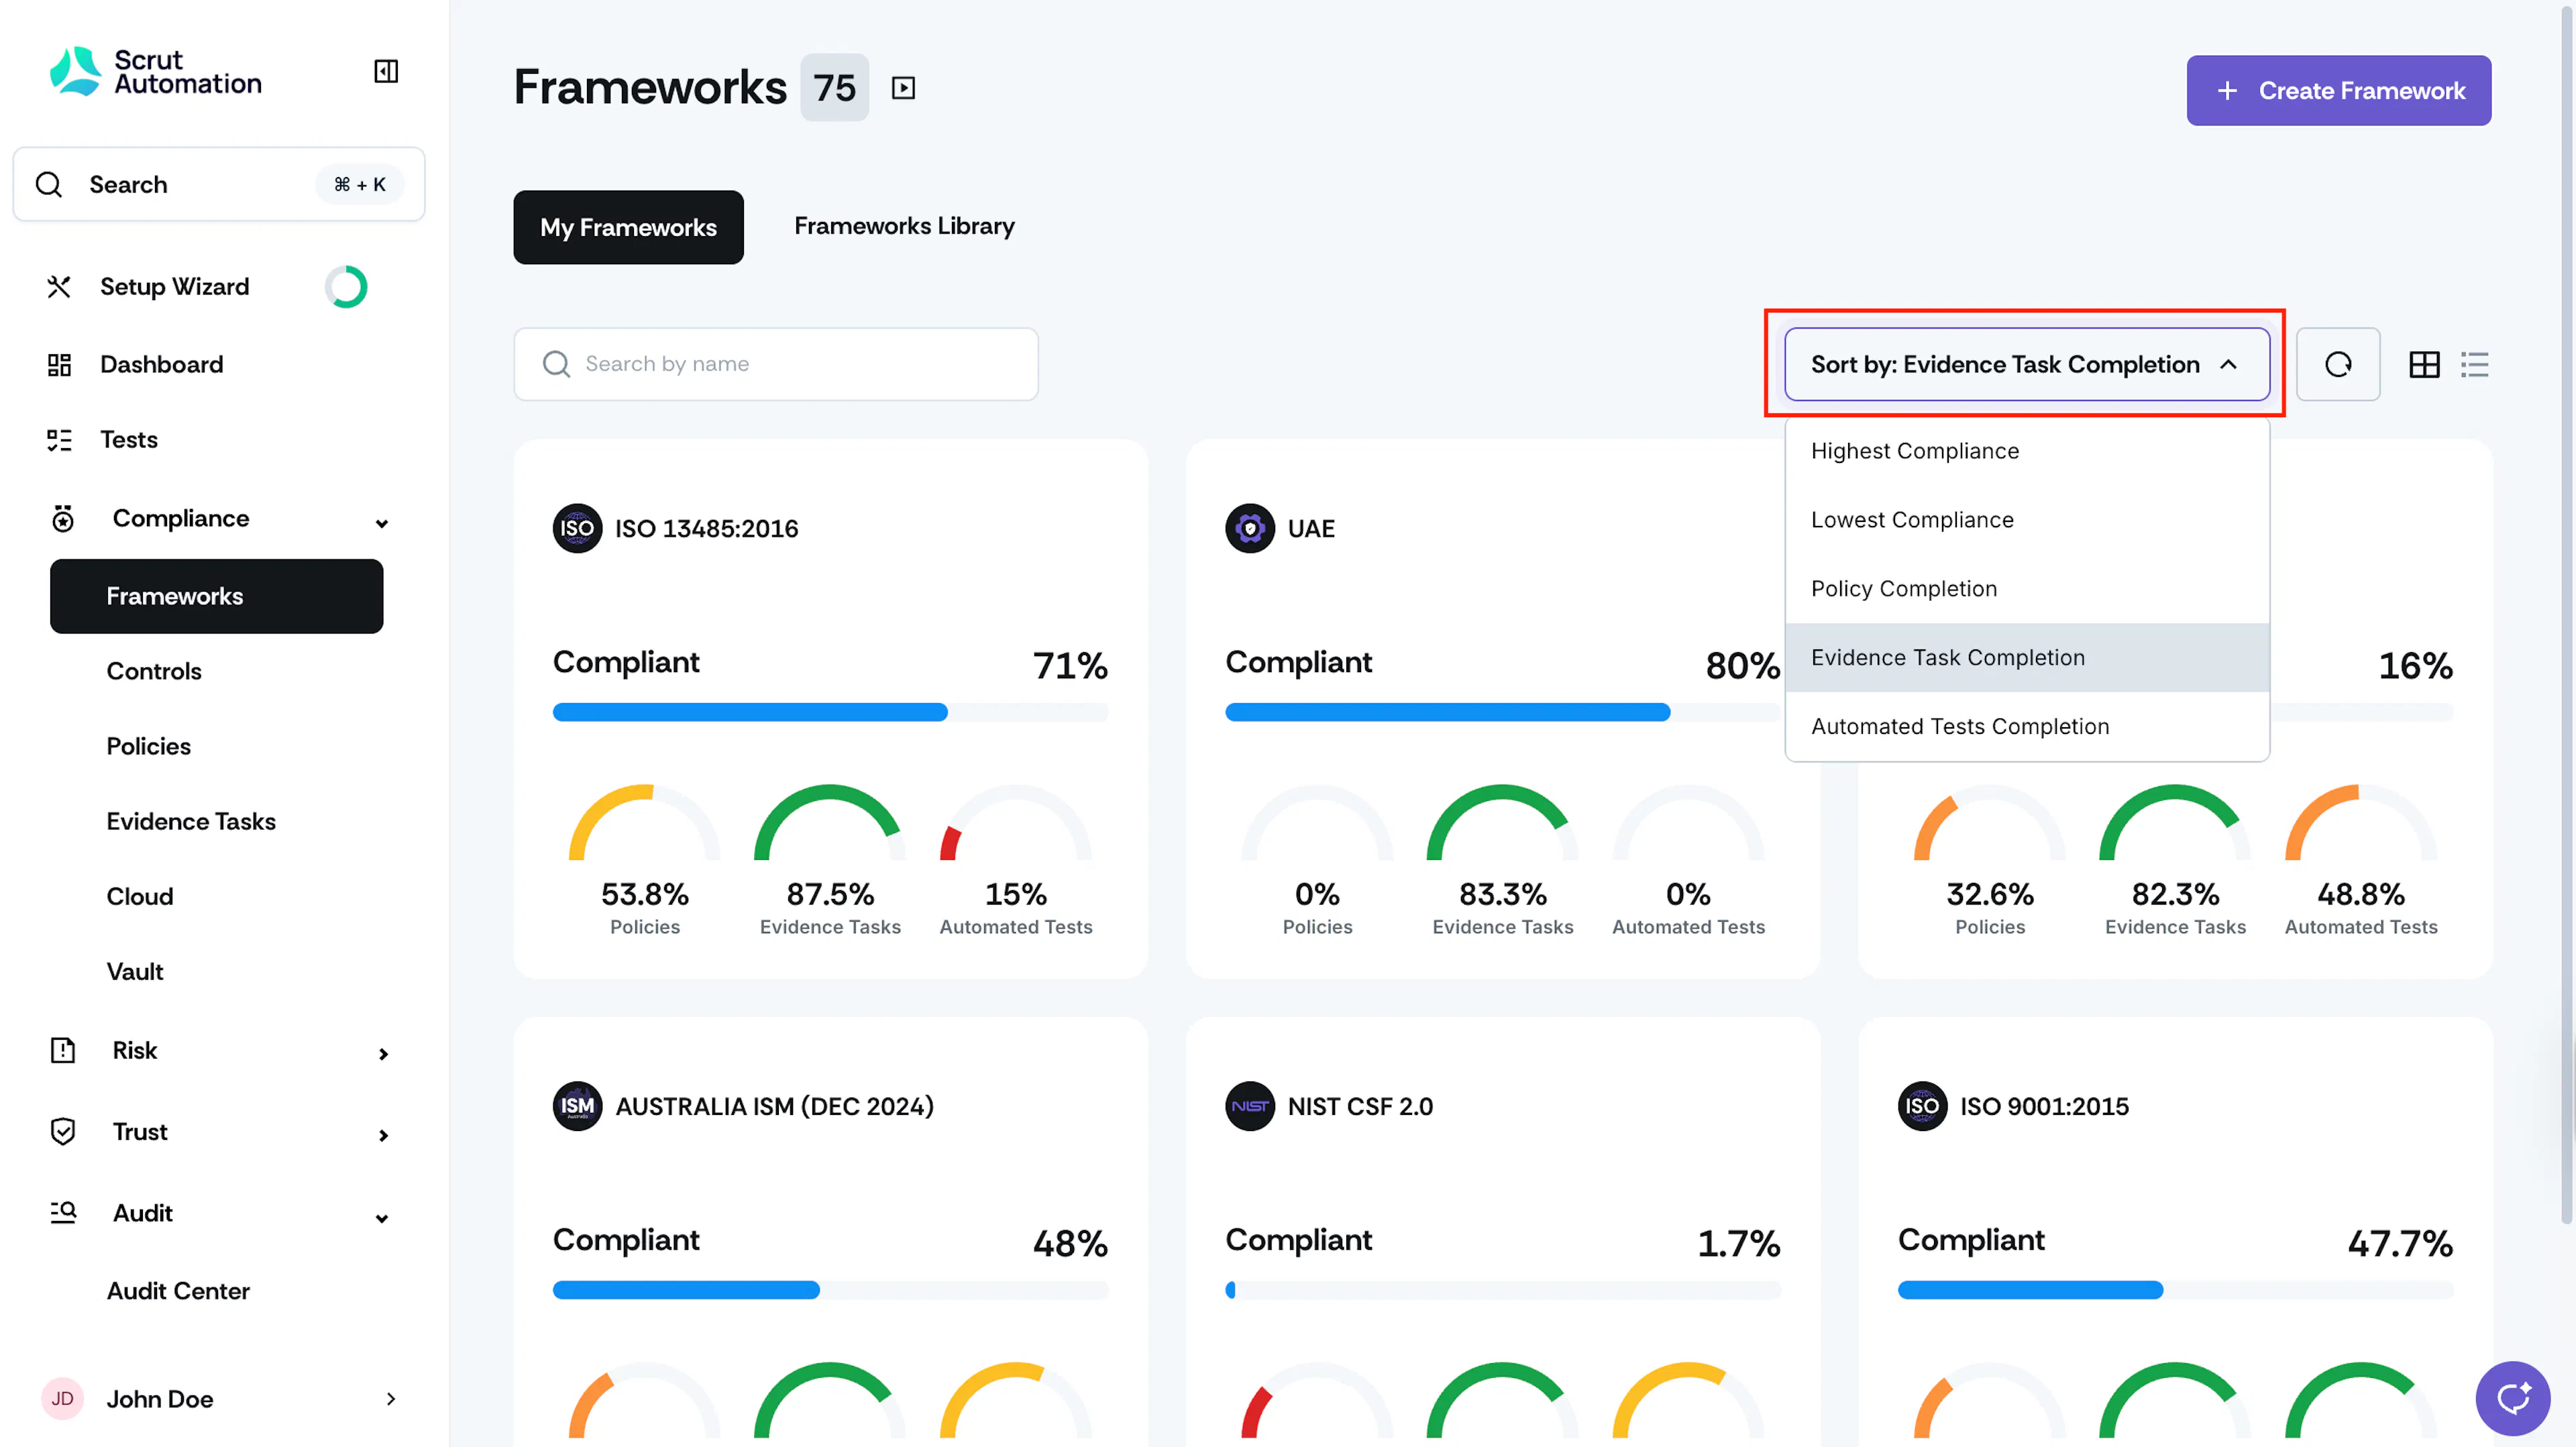
Use the Sort By filter to reorder Frameworks based on Highest Compliance, Lowest Compliance, Policy Completion, Test Completion and Evidence Completion to give a better understanding of your compliance progress.
Frameworks Table View
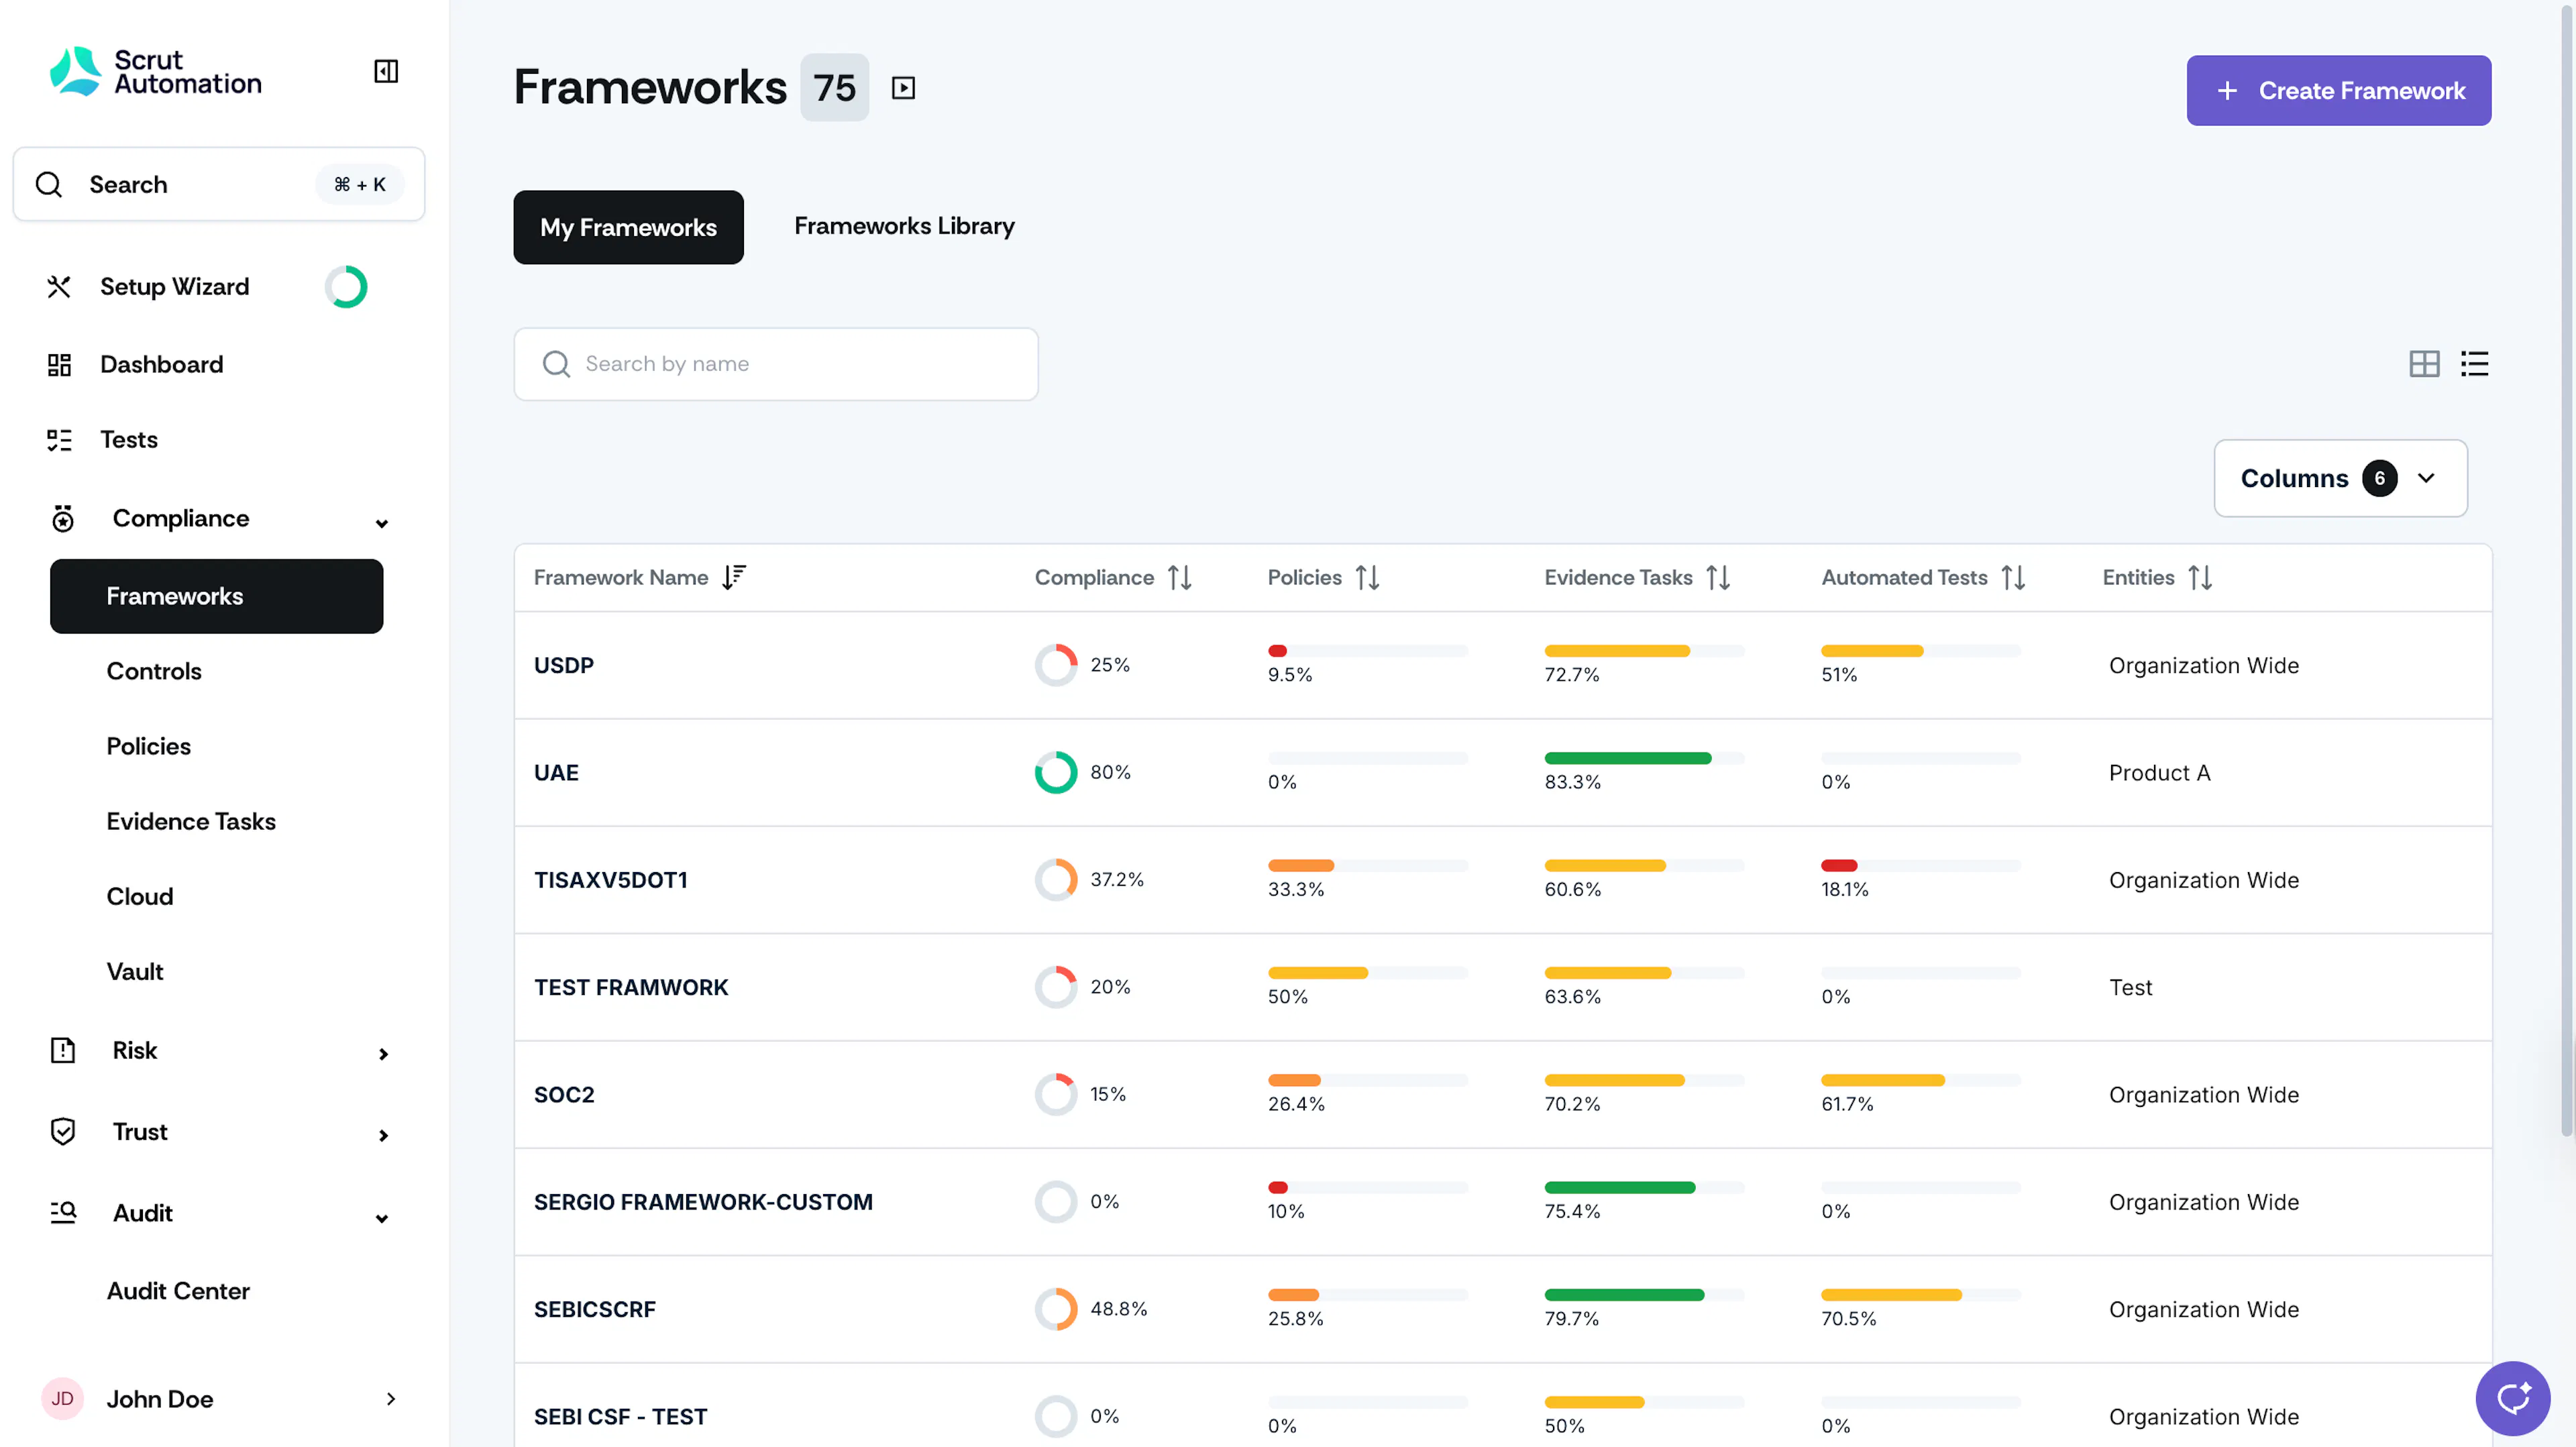
Switch to the List view to view the Framework table. This presents the information of all frameworks in your account in a table format. The table includes details such as:
- Framework name
- Upcoming audit date (This information is not available in the card view, but is present in the table view)
- Compliance percentage
- Percentage of published policies
- Percentage of completed evidence tasks
- Percentage of compliant tests
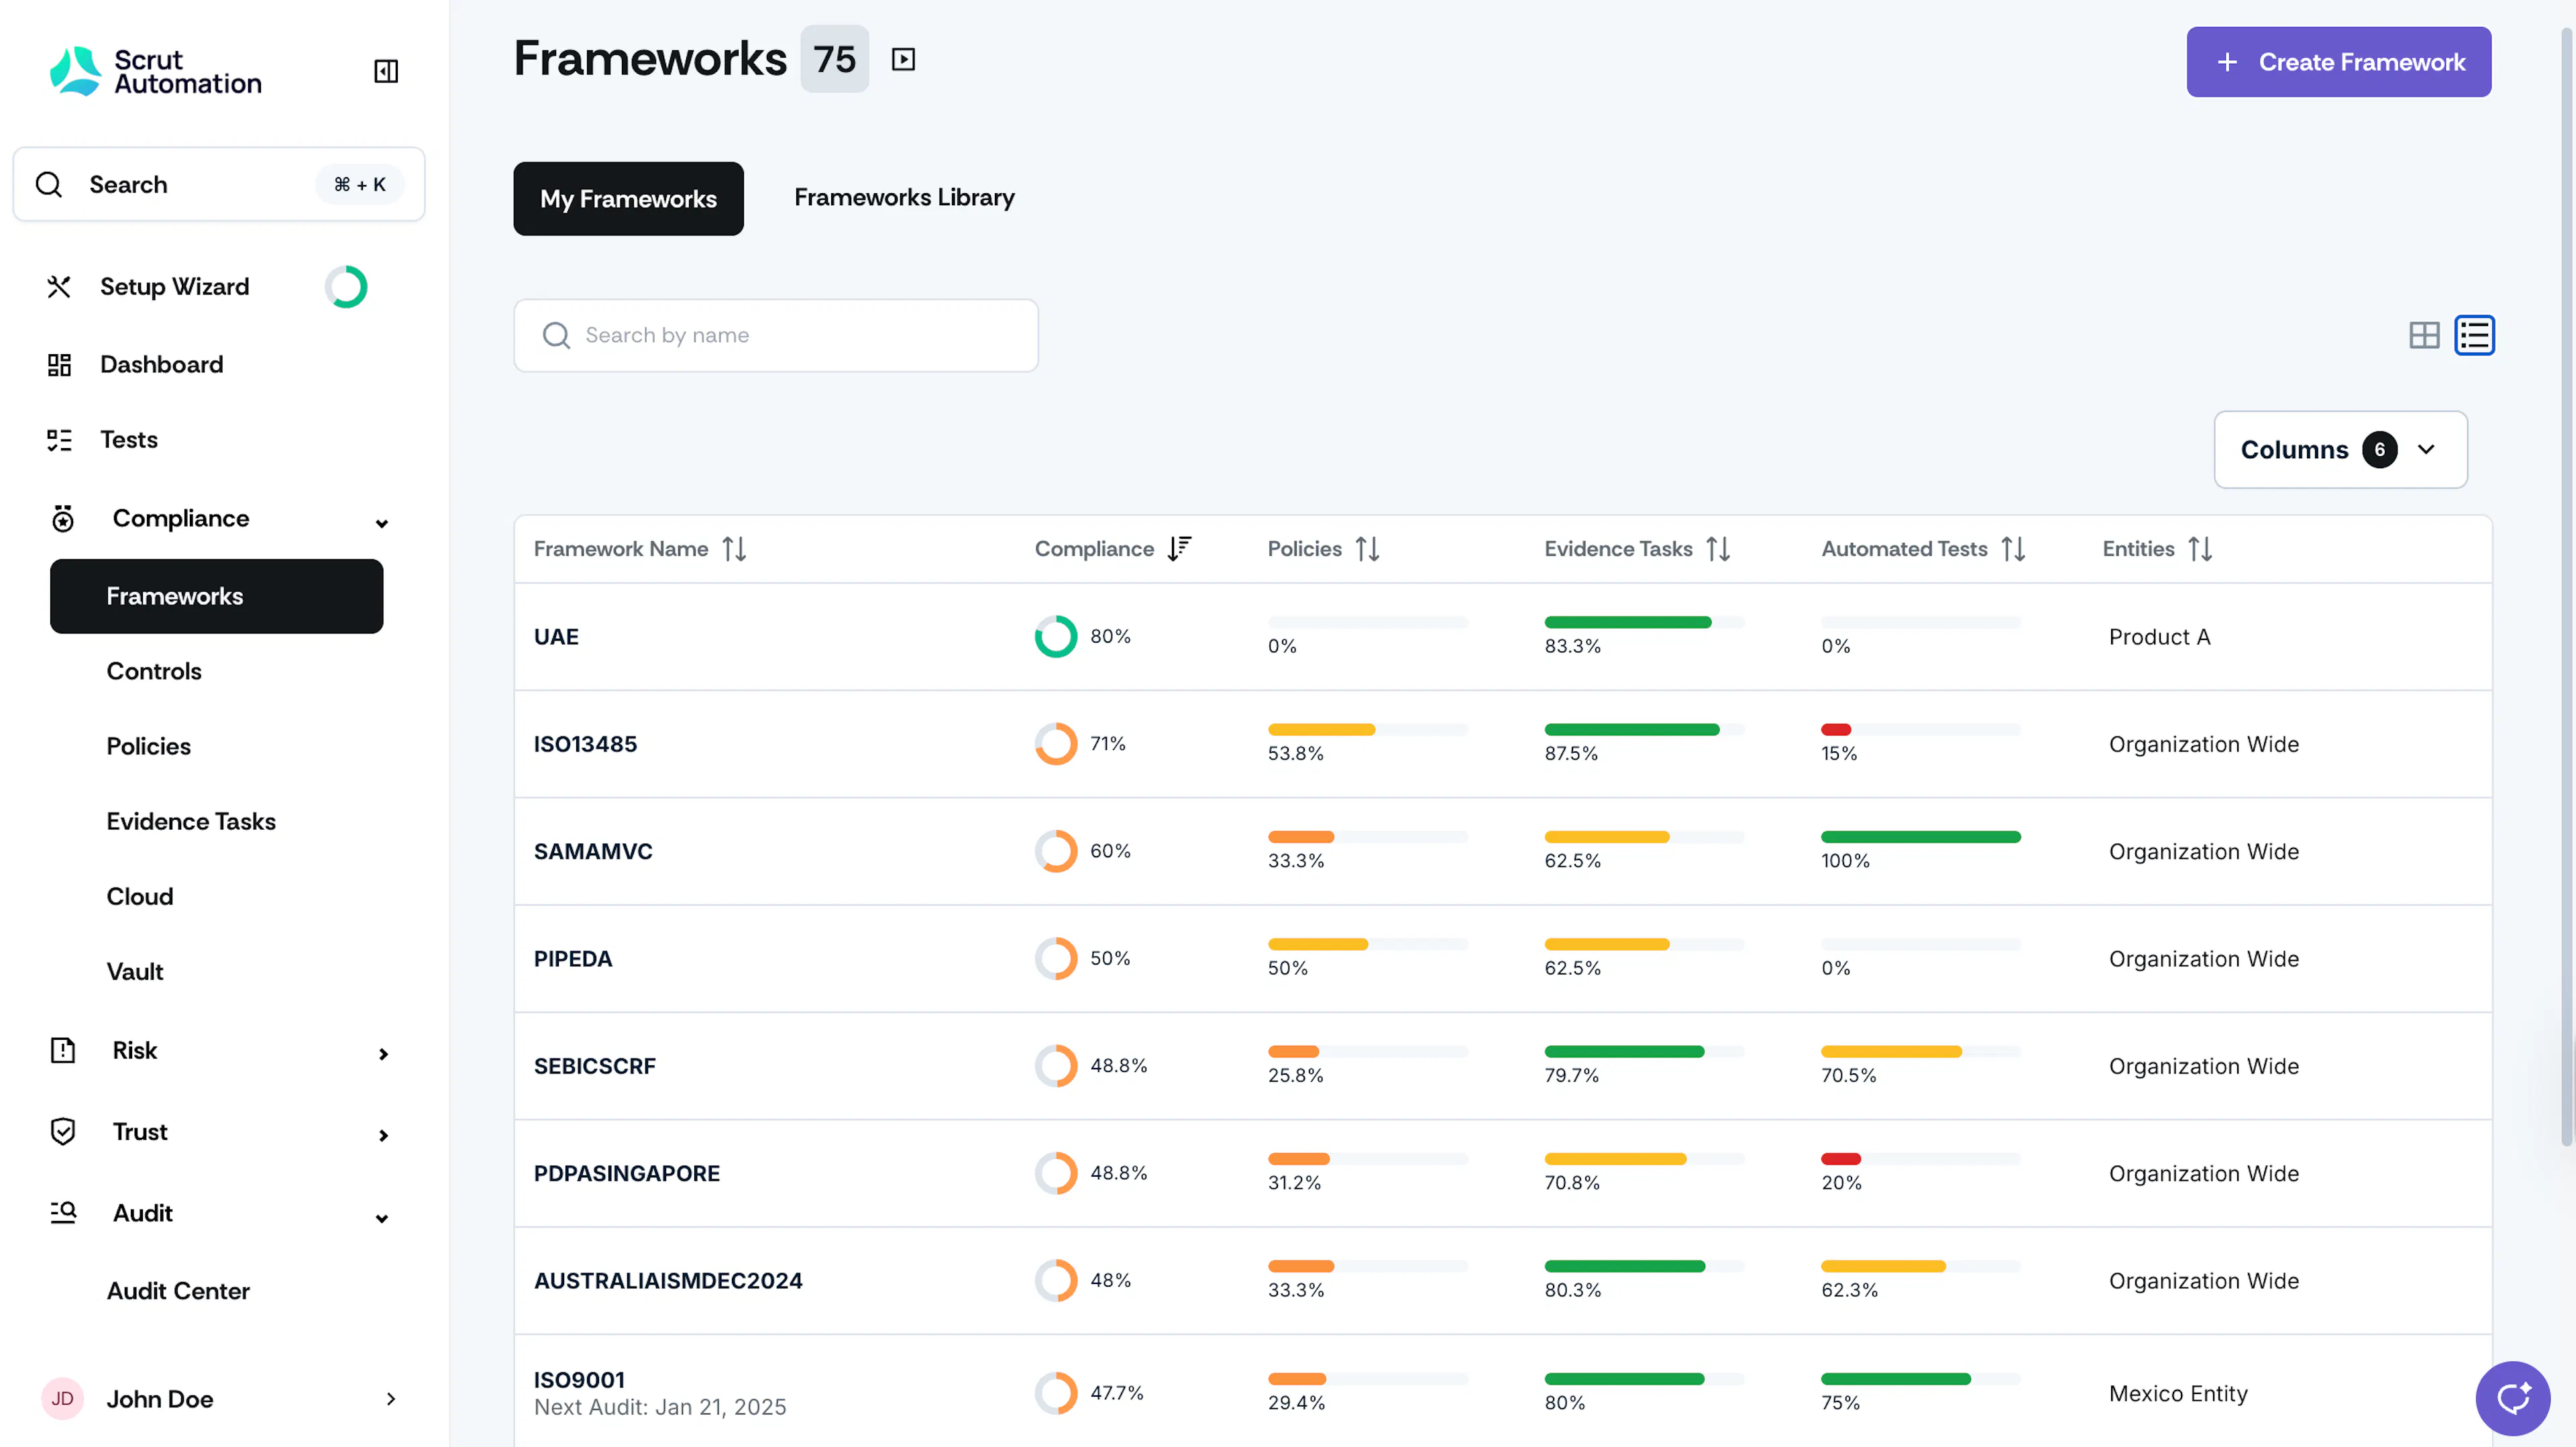
Note
The calculations remain the same as in the card view.
Pro Tip!
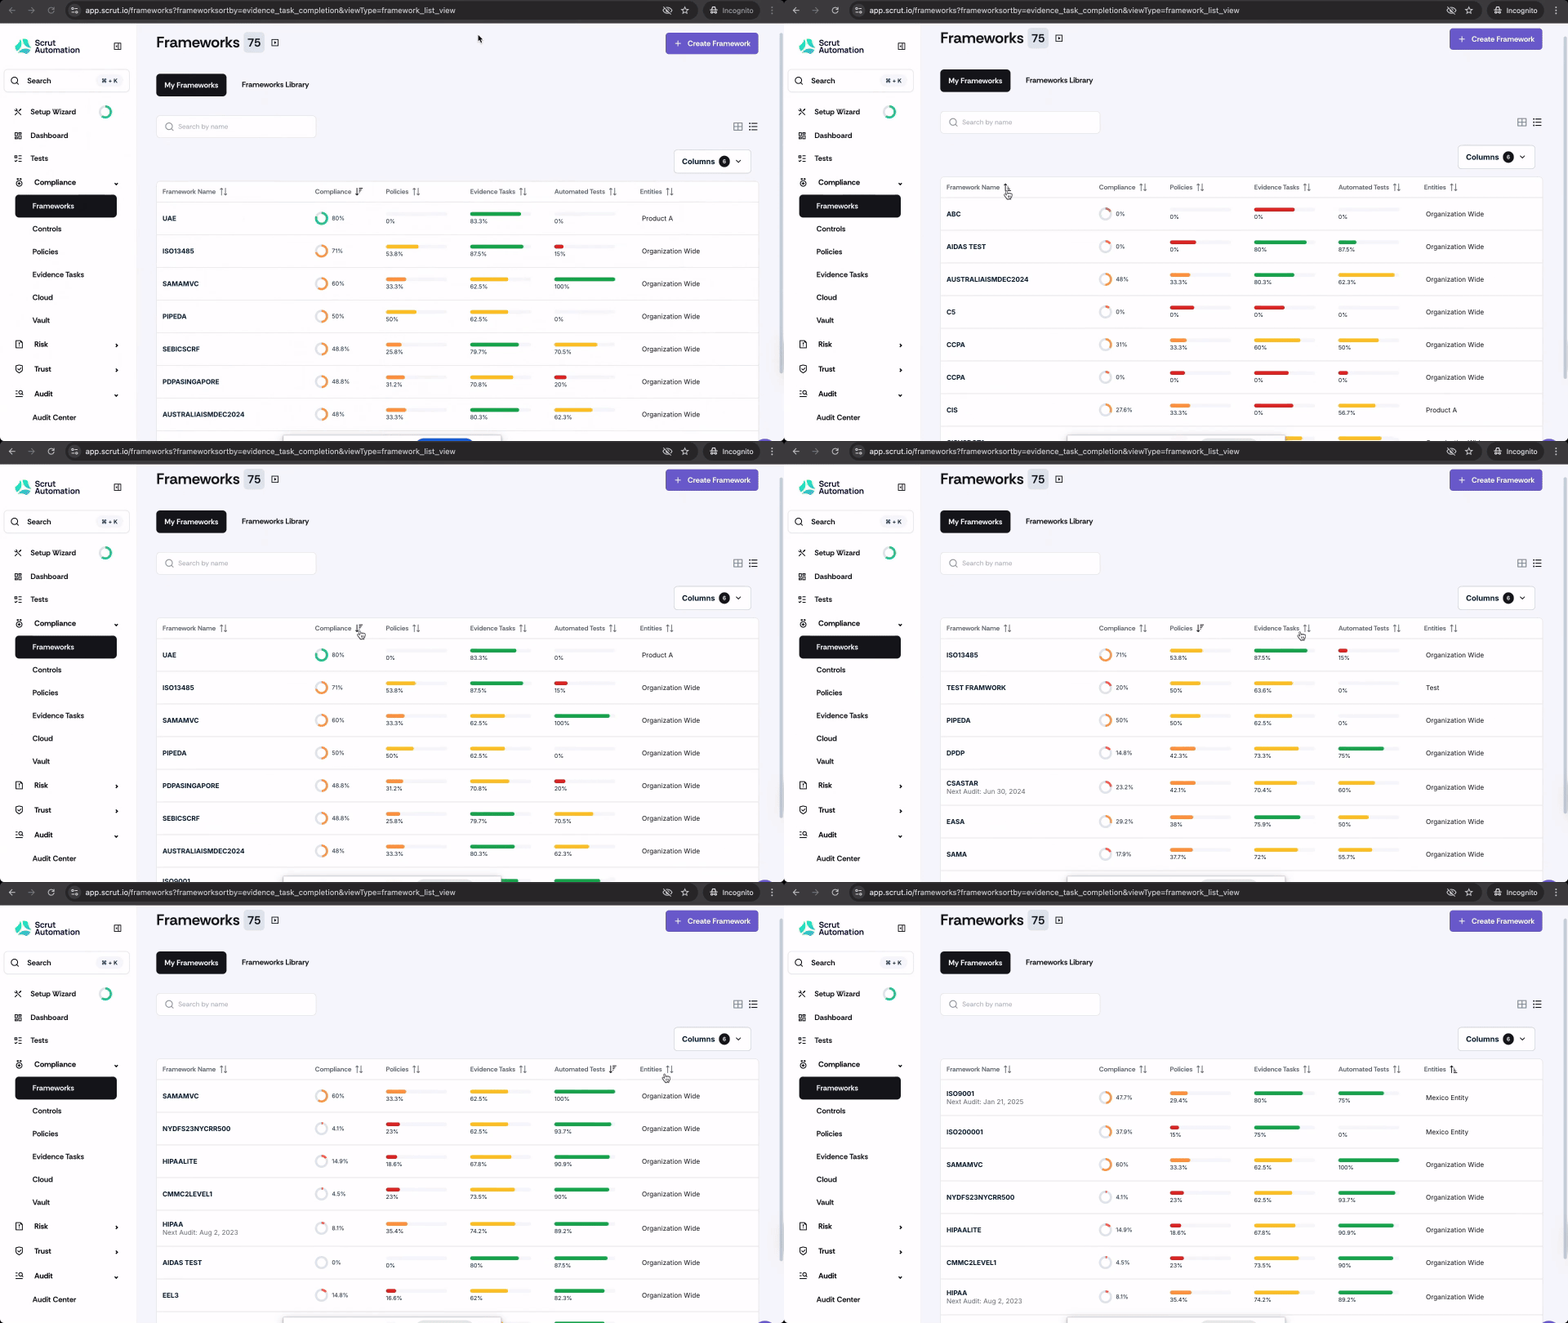
Use the sort by icons on each column to reorder the frameworks in the table.