

Set up a Scrut Monitor for Jira
In this guide, we walk you through the process of setting up Scrut Monitor to fetch a list of compliance issues from your Jira instance and attach them as automated evidence to evidence tasks.
Overview
This feature allows you to automatically fetch Jira issues as evidence in Scrut. You can set up Scrut Monitors to:
- Run custom JQL queries on Jira at a set cadence (daily, weekly, monthly, etc.)
- Automatically generate timestamped CSV/PDF files of issues
- Attach these files as automated evidence to your Scrut evidence tasks
Prerequisites
How To Configure Scrut Monitor for Jira
Step 1: Access Evidence Tasks
-
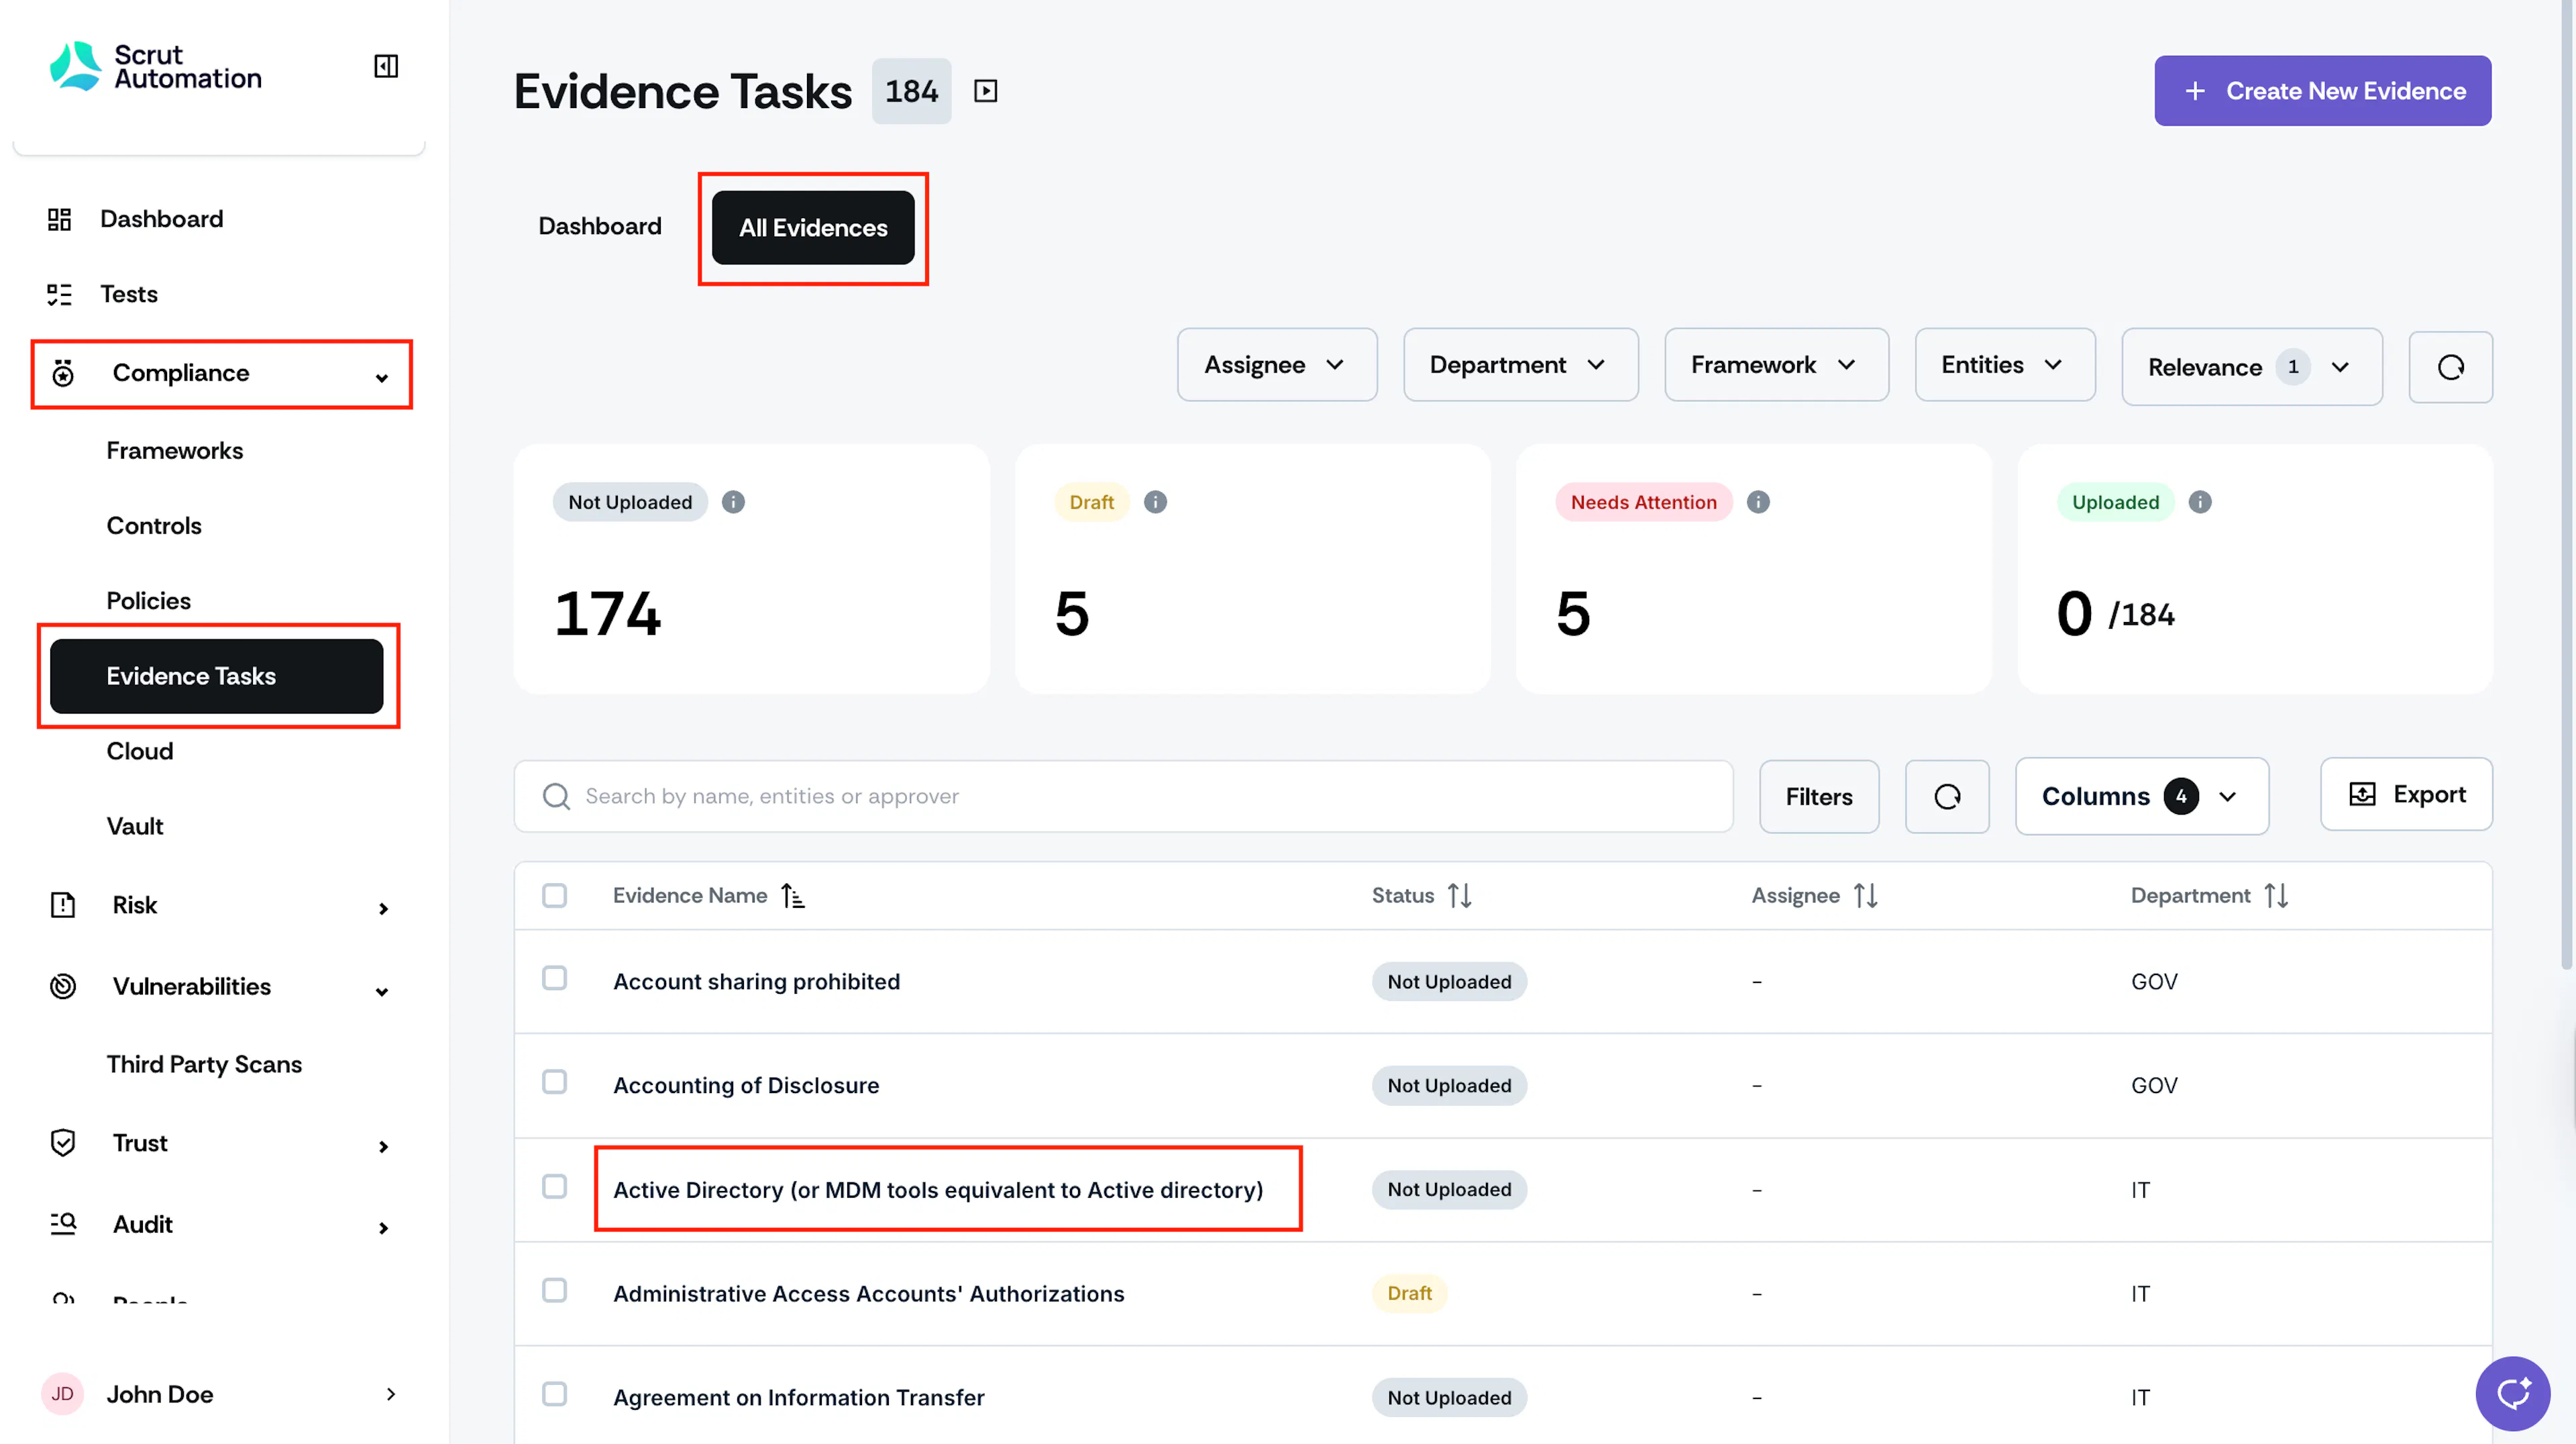
Sign in to Scrut and navigate to Compliance → Evidence Tasks using the left navigation panel.
-
Click the All Evidences tab.
-
Click on the evidence task for which you want to set up the Scrut Monitor to fetch Jira issues.
Step 2: Configure Scrut Monitor Workflow
-
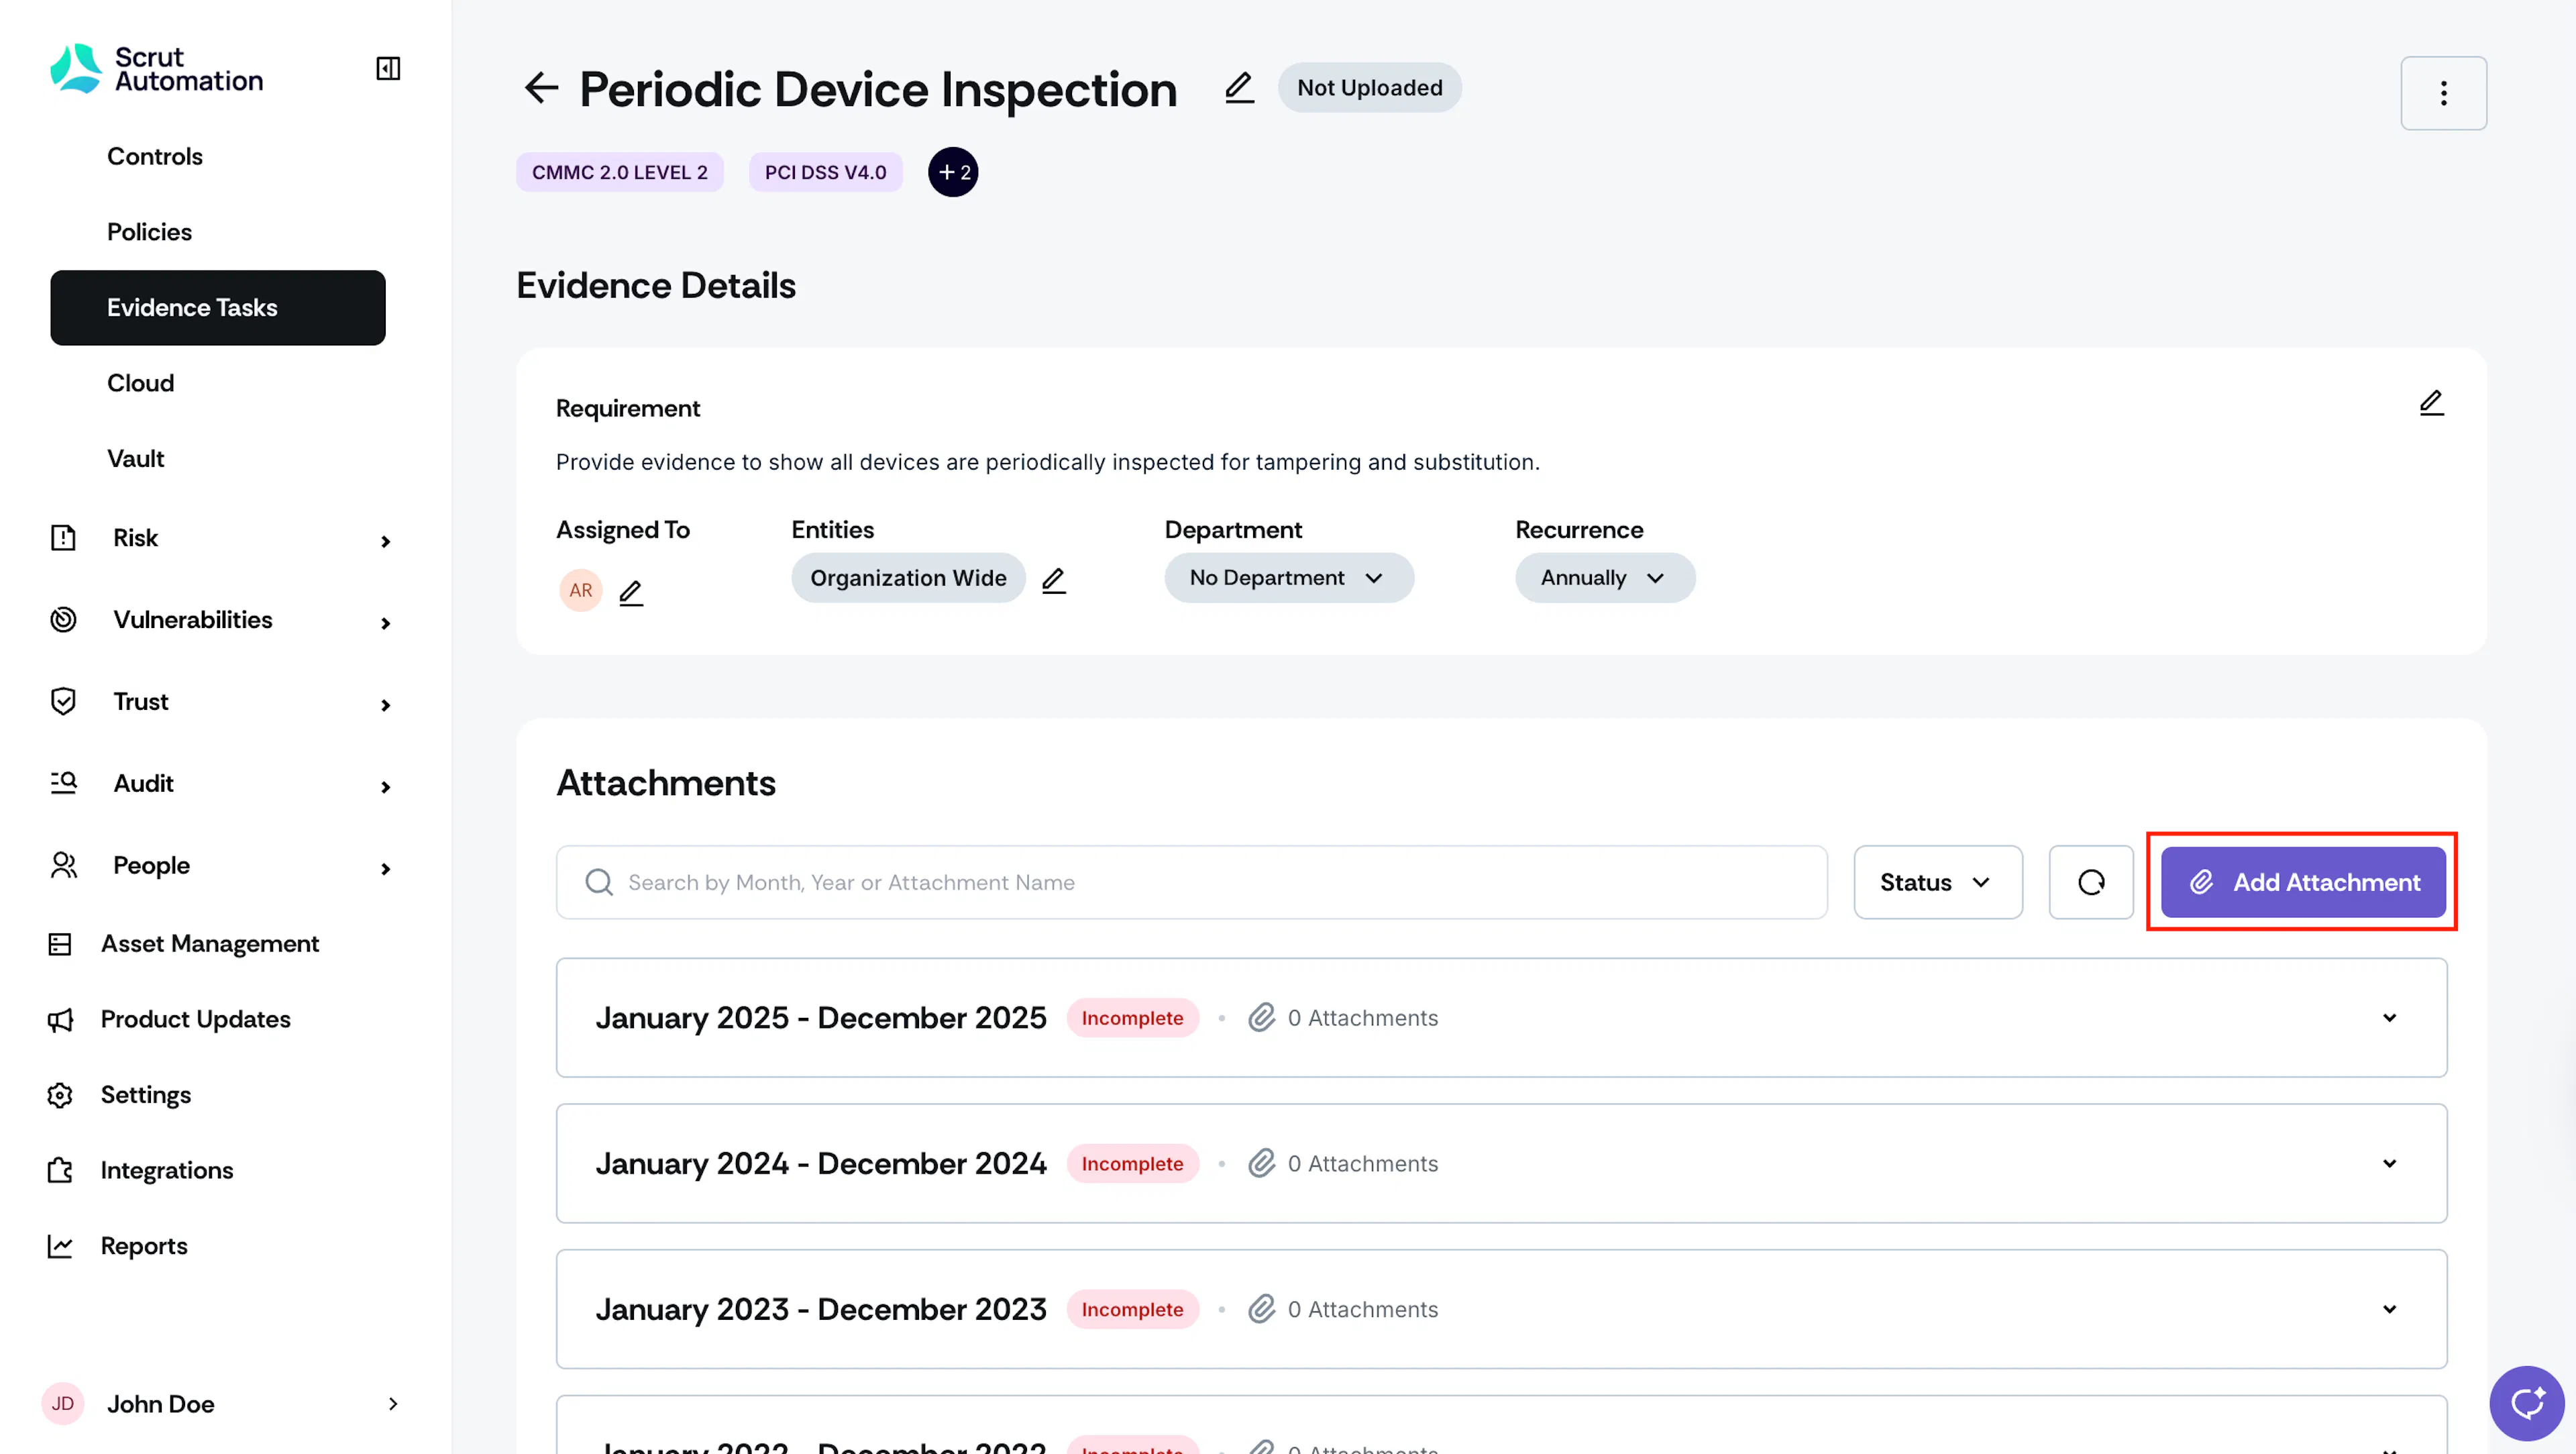
Click the Add/Upload Attachment button on the evidence details page.
-
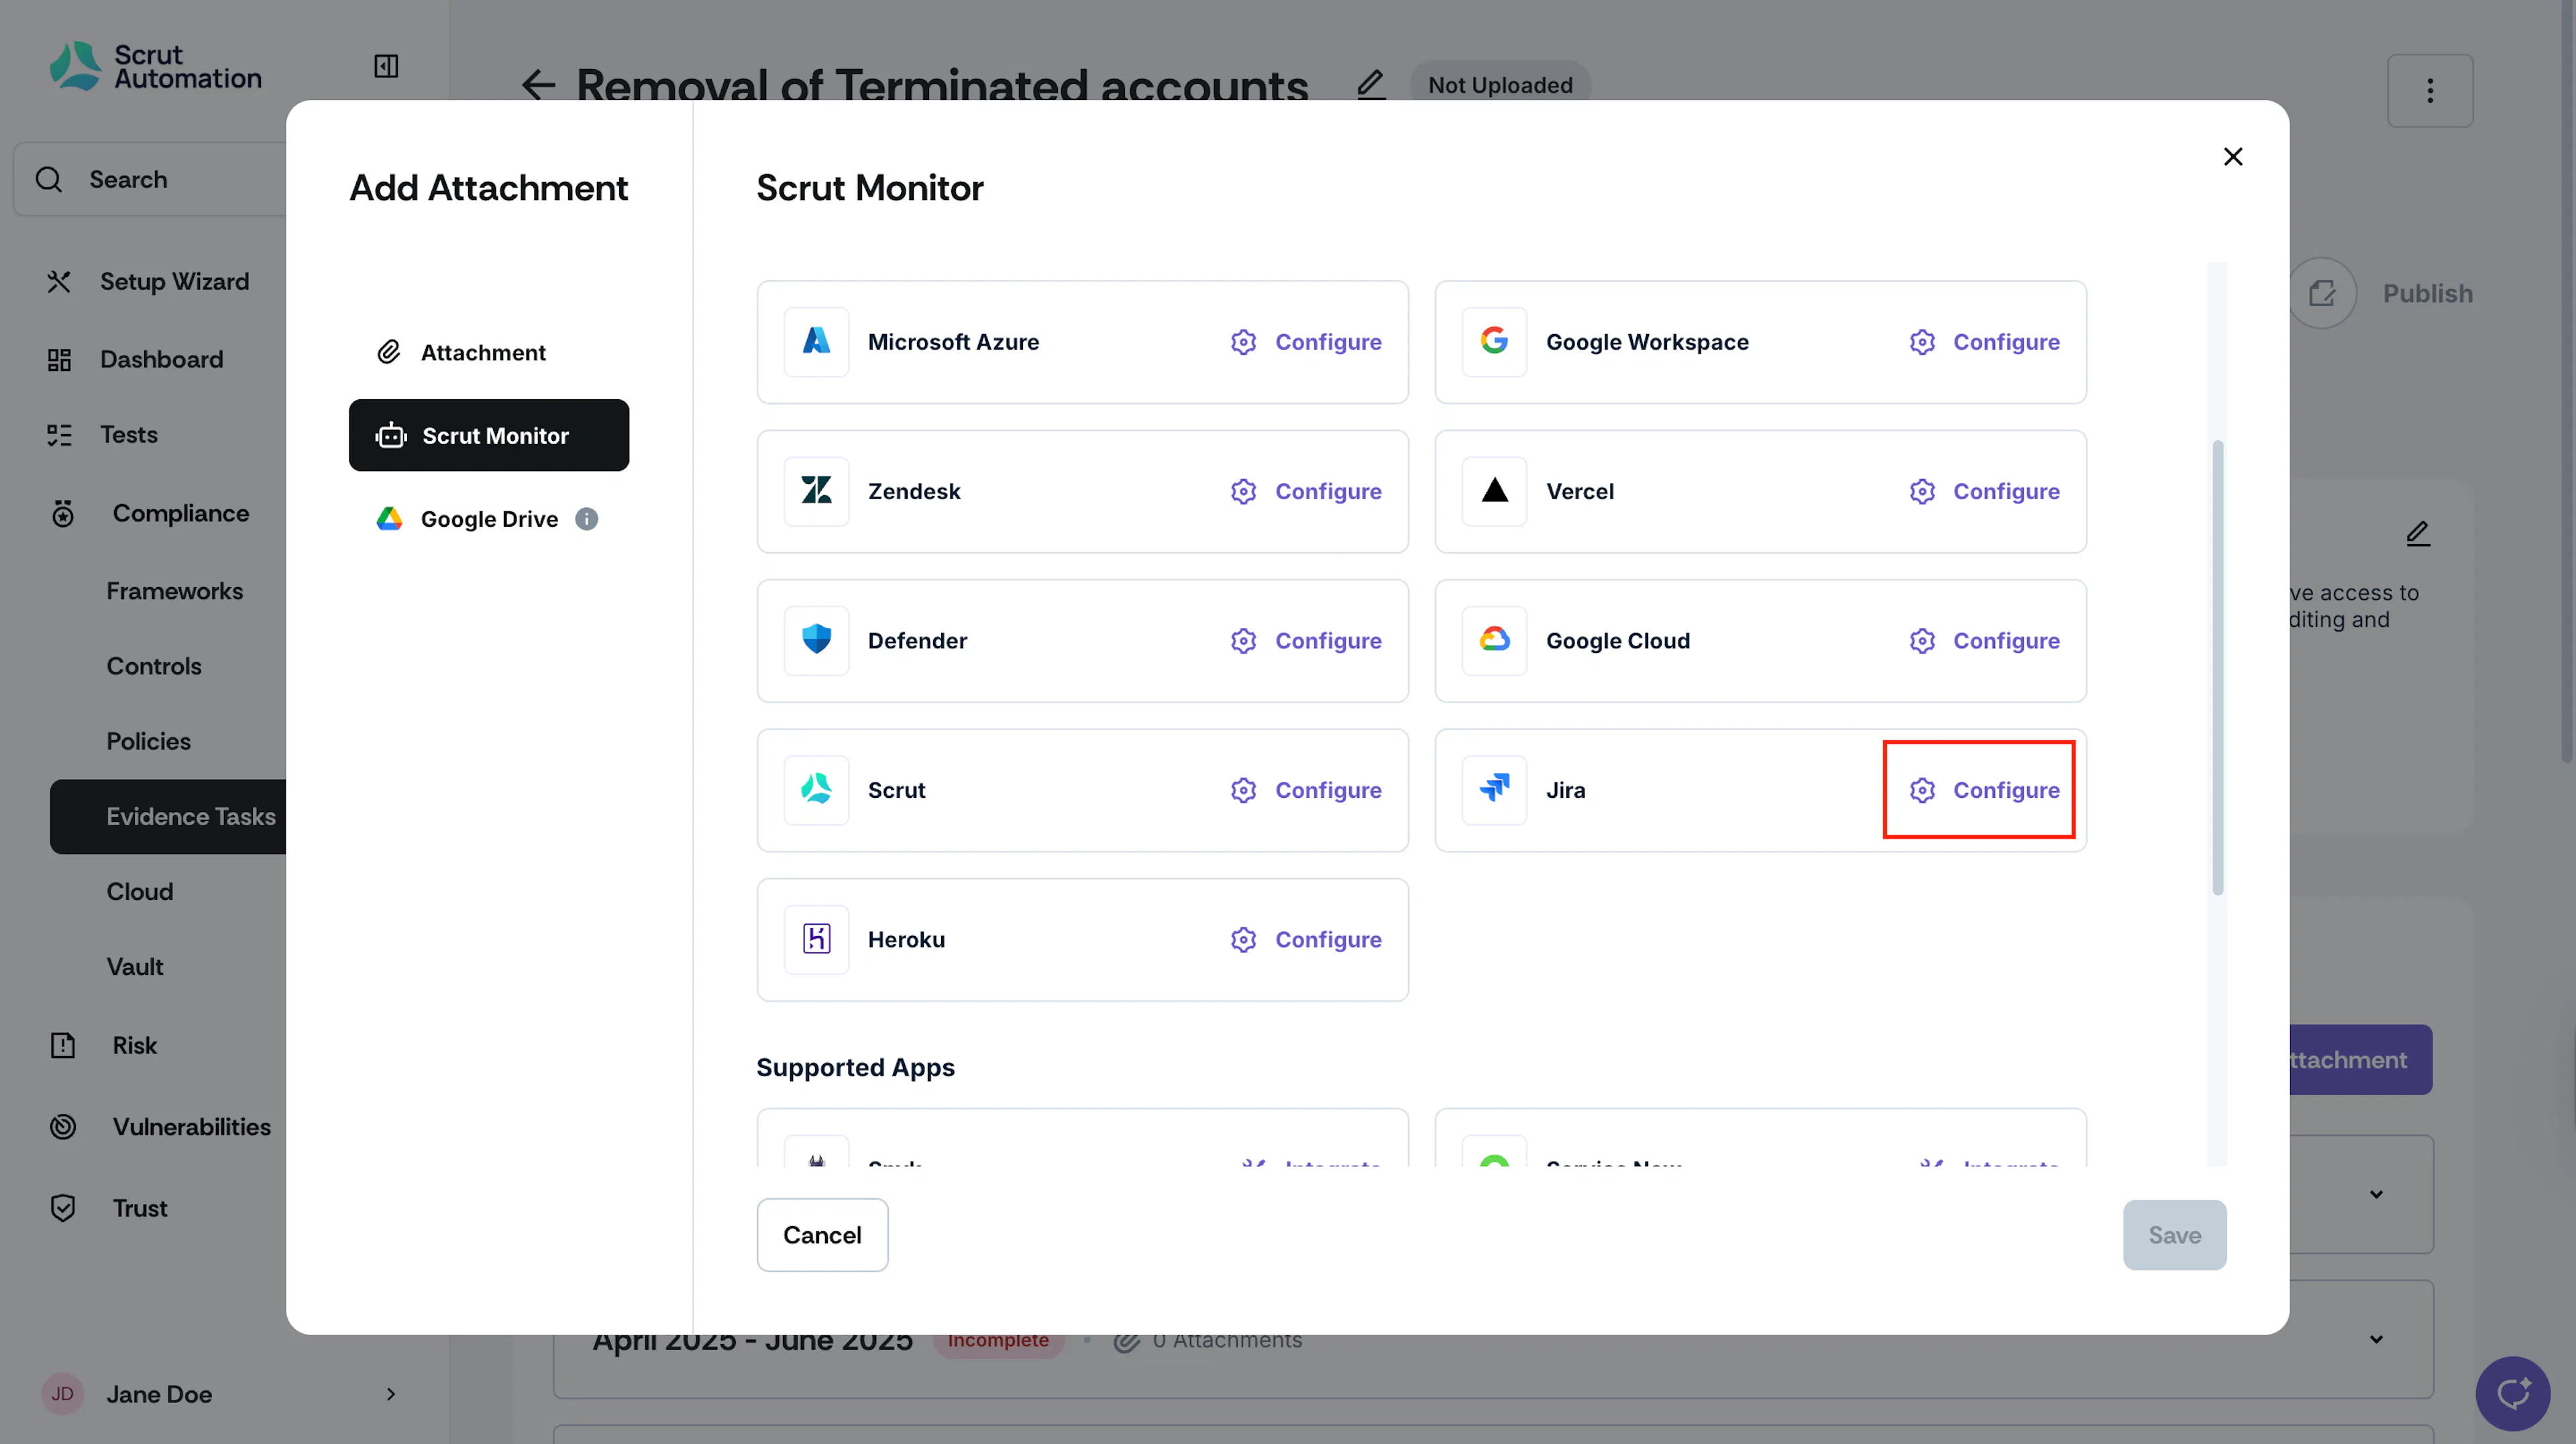
Click on the Scrut Monitor tab, and click the Configure button next to the Jira application.
-
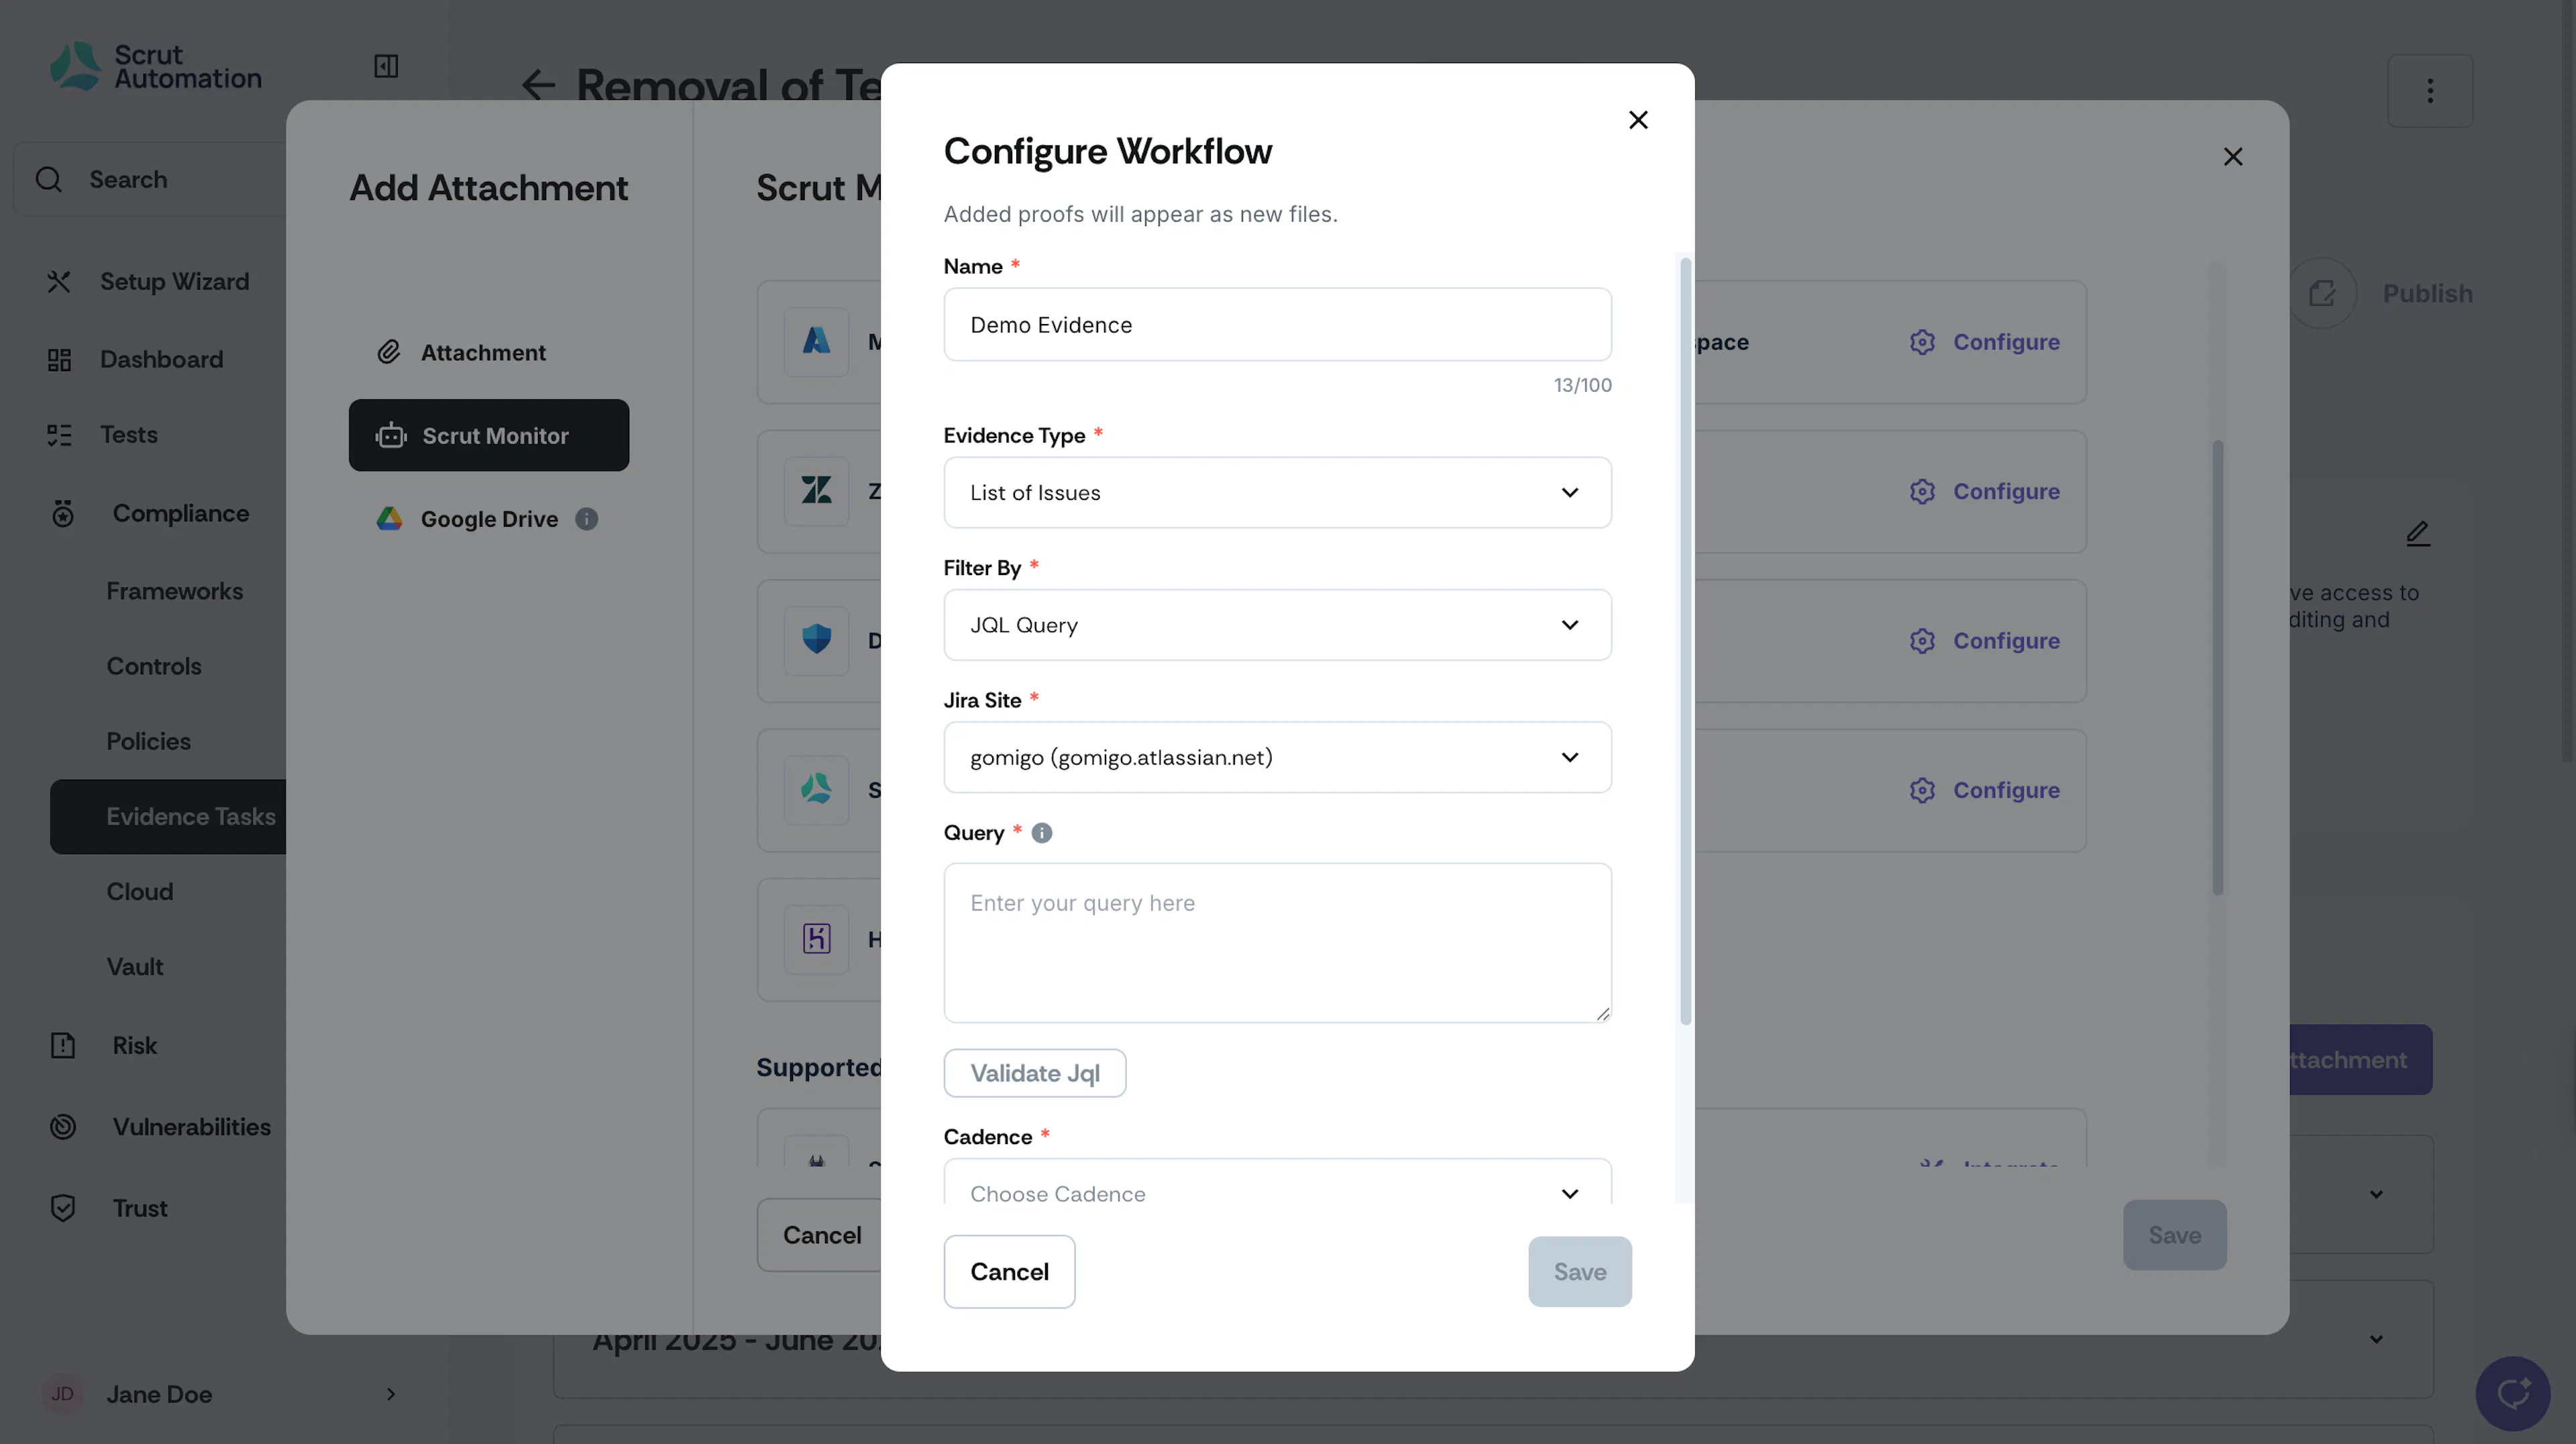
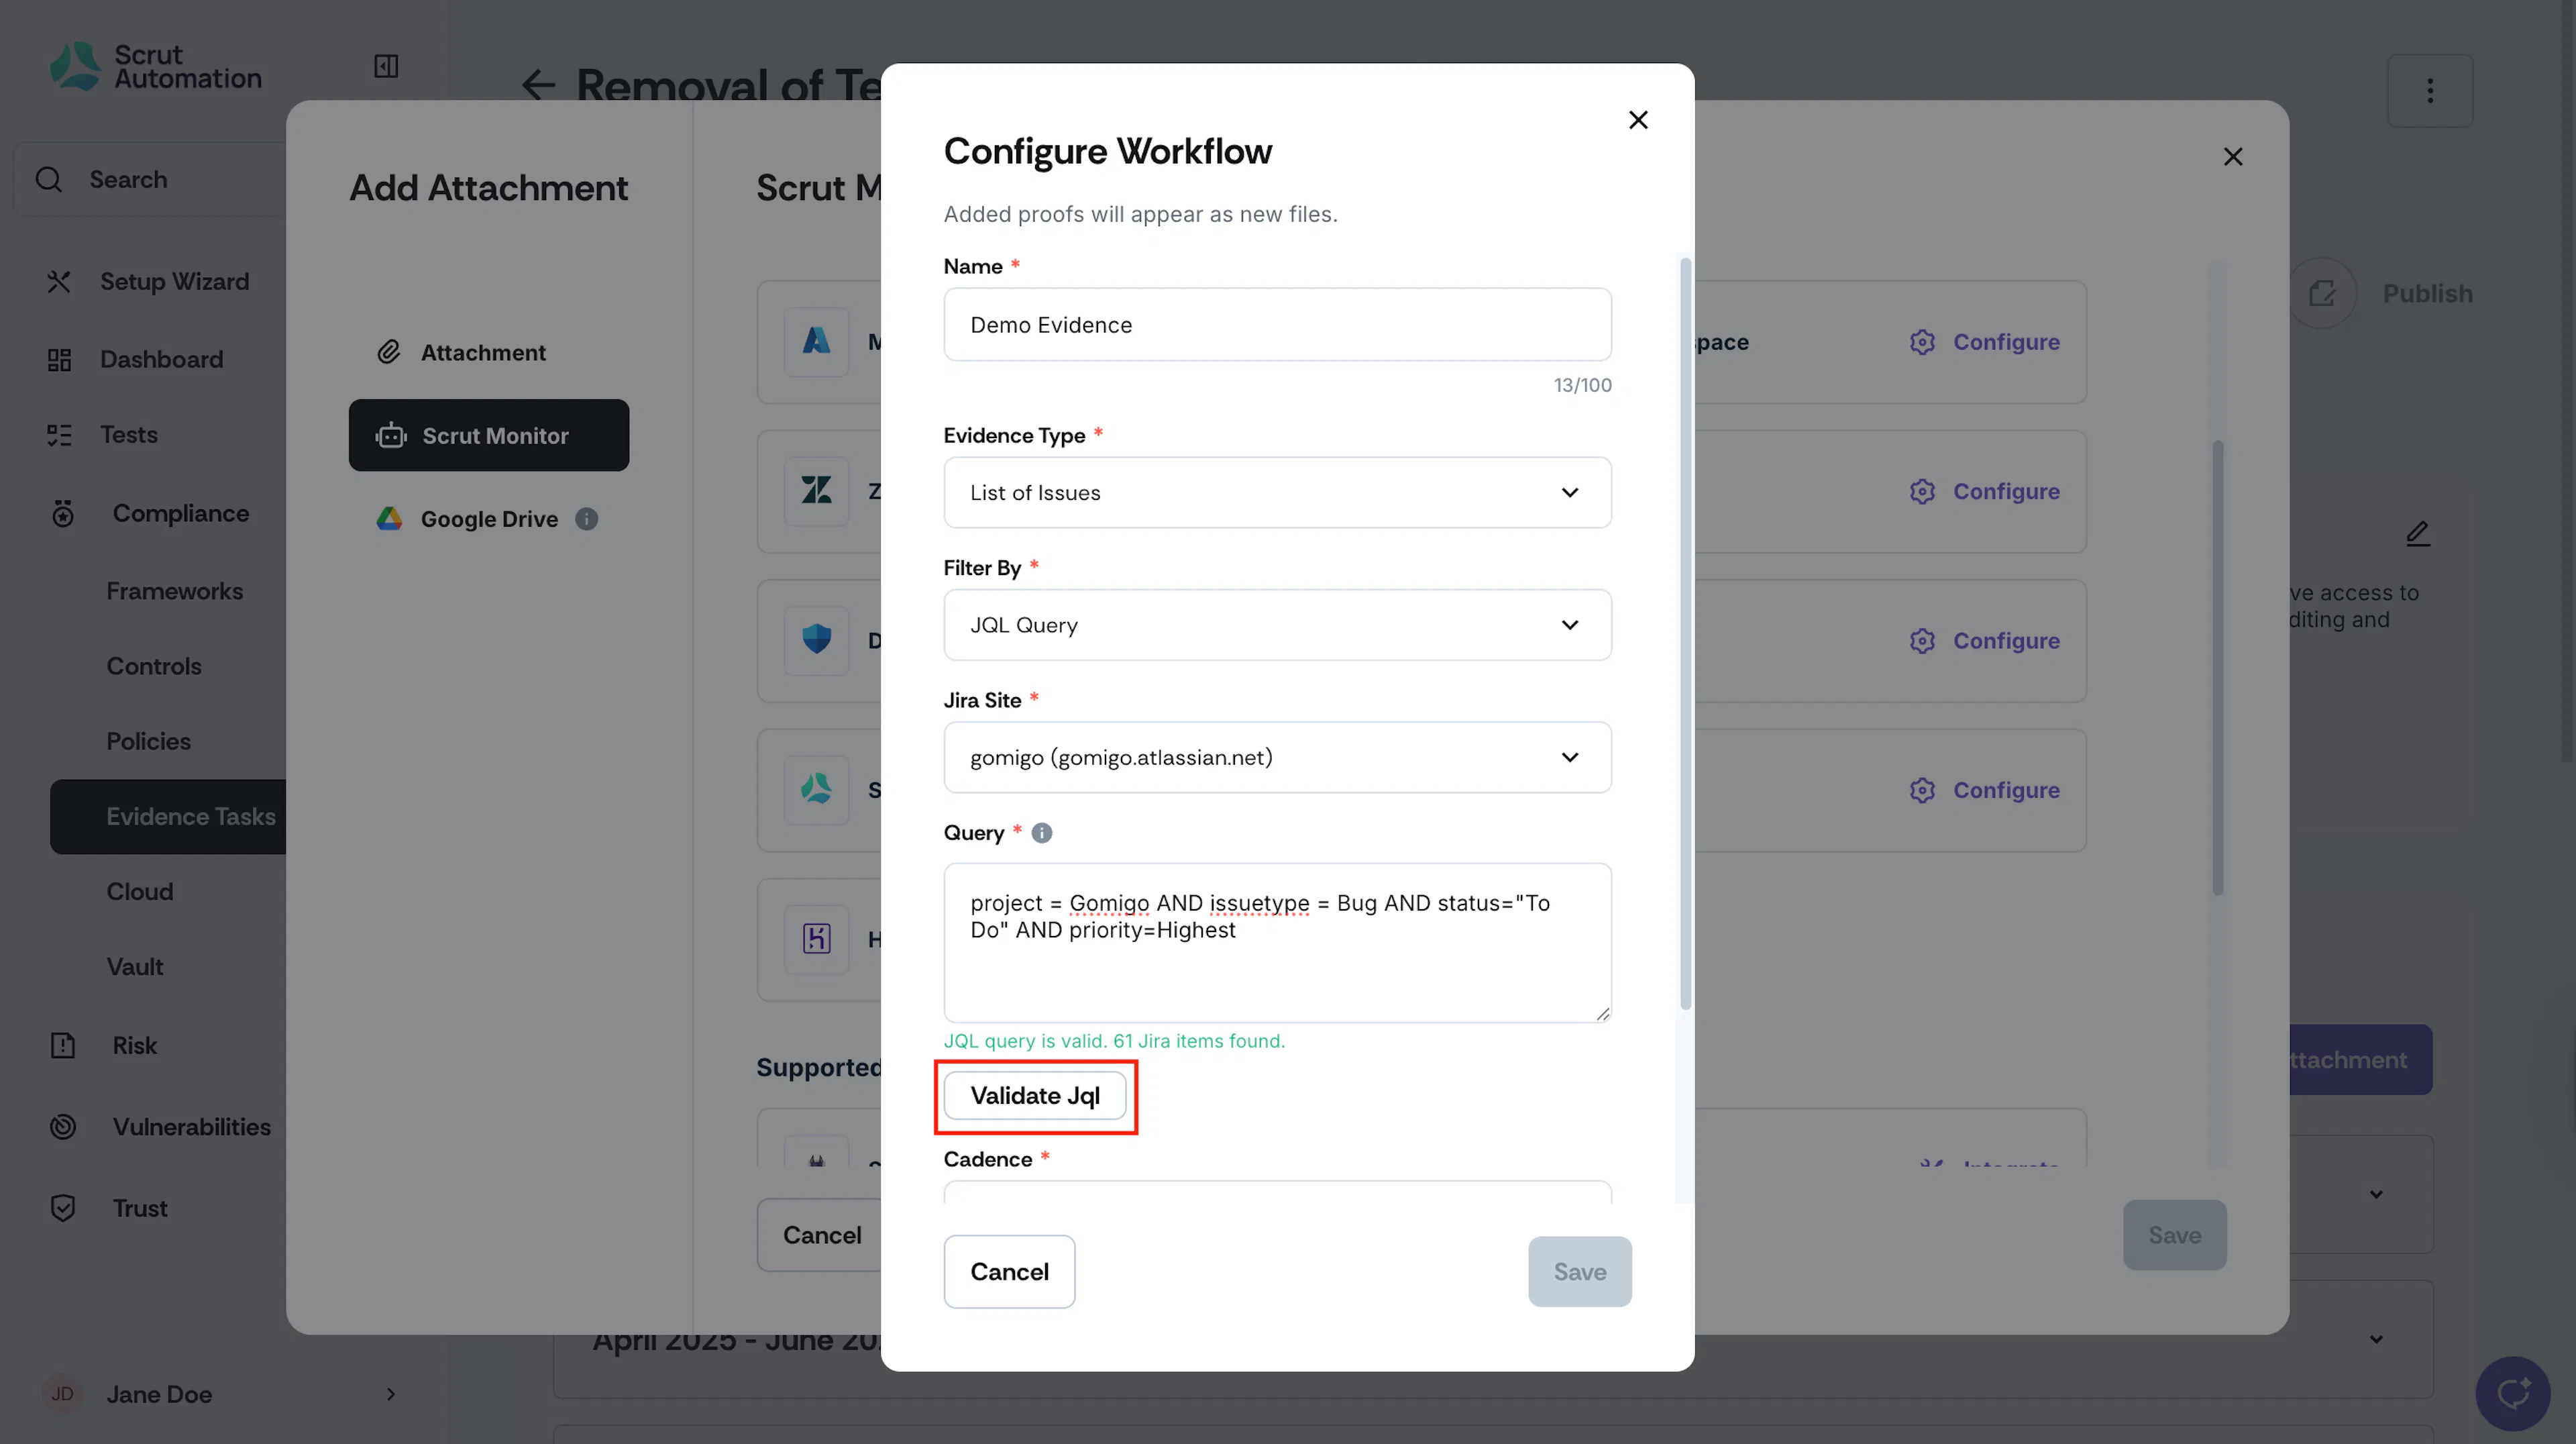
Enter a name for the Evidence and set the Evidence Type to “List of Issues.”
-
The Filter By field is automatically set to JQL Query.
-
From the Jira Site dropdown, select your preferred Jira workspace.
Step 3: Create and Validate Your JQL Query
Pro Tip!
Refer to Atlassian’s help documentation on how to perform advanced search with JQL query.
You can generate your preferred JQL query in Jira using one of these two methods:
-
With Atlassian Intelligence: Describe the work items you need in plain language, and AI will generate the JQL query for you.
-
With Basic Filters: Switch to the JQL view and enter your JQL query. A good starting point is to search for issues within a specific project. For example, to find all issues in a project with the key "PROJ," you would type:
project = "PROJ" -
As you type, Jira will provide auto-complete suggestions for fields, operators, and values, which can help you write your query correctly.
-
Add More Conditions: To narrow your search, you can add more clauses using logical operators like
AND,OR, andNOT. For instance, to find all open bugs in "PROJ," you would add conditions for issue type and status:project = "PROJ" AND issuetype = "Bug" AND status = "Open"JQL is case-insensitive, so
projectandPROJECTwill work the same. -
Execute the Search: Once you have typed your query, click Enter to display the results.
Once you have the query in Jira, copy and paste it into the Query field in Scrut. Click Validate JQL to confirm if it works.
Step 4: Configure Cadence and Format
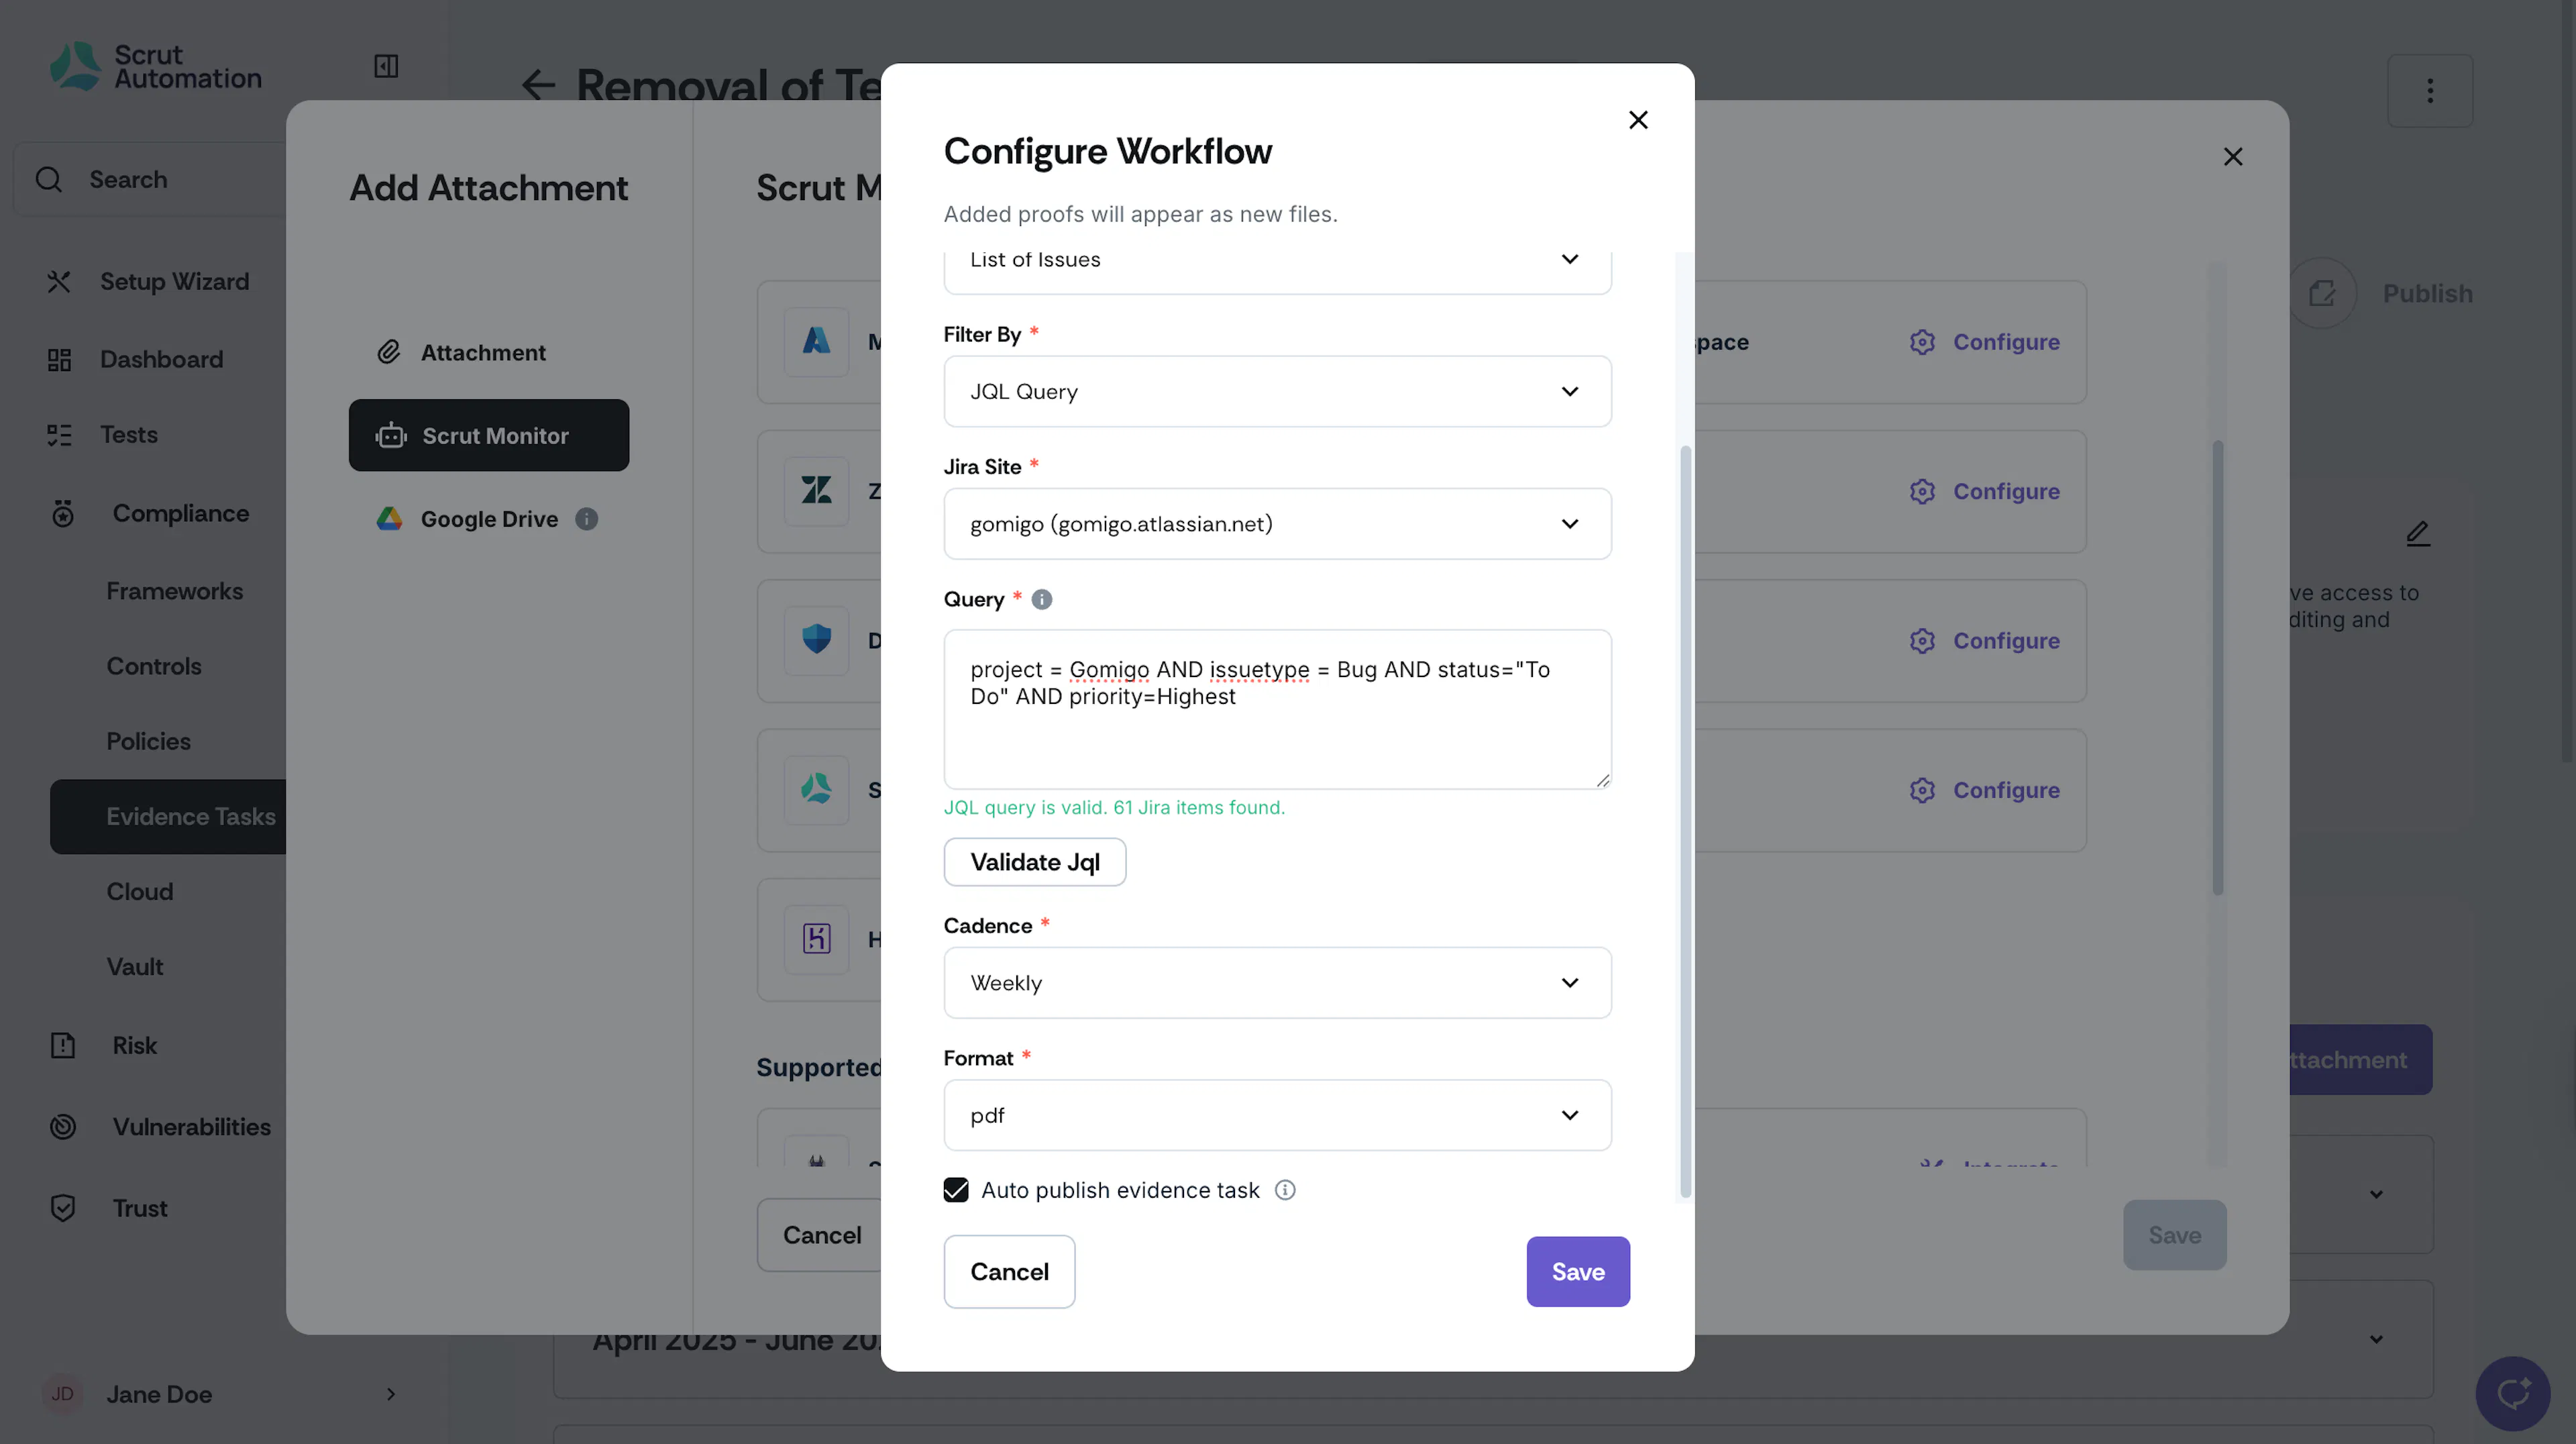
- Choose the Cadence (how often you want the Scrut Monitor to fetch the evidence from Jira). You can choose from: Once, Daily, Weekly, Monthly, or Yearly.
- Select the Evidence Type. Choose from PDF or CSV.
Step 5: Save the Workflow
-
Select the Auto-publish evidence task checkbox to auto-publish the evidence task.
Note: If left unselected, the task status will change to draft whenever the Scrut Monitor attaches new evidence, and you’ll need to publish it manually.
Pro Tip!
Leave it unchecked if you want to manually review the evidence before publishing.
-
Click Save.
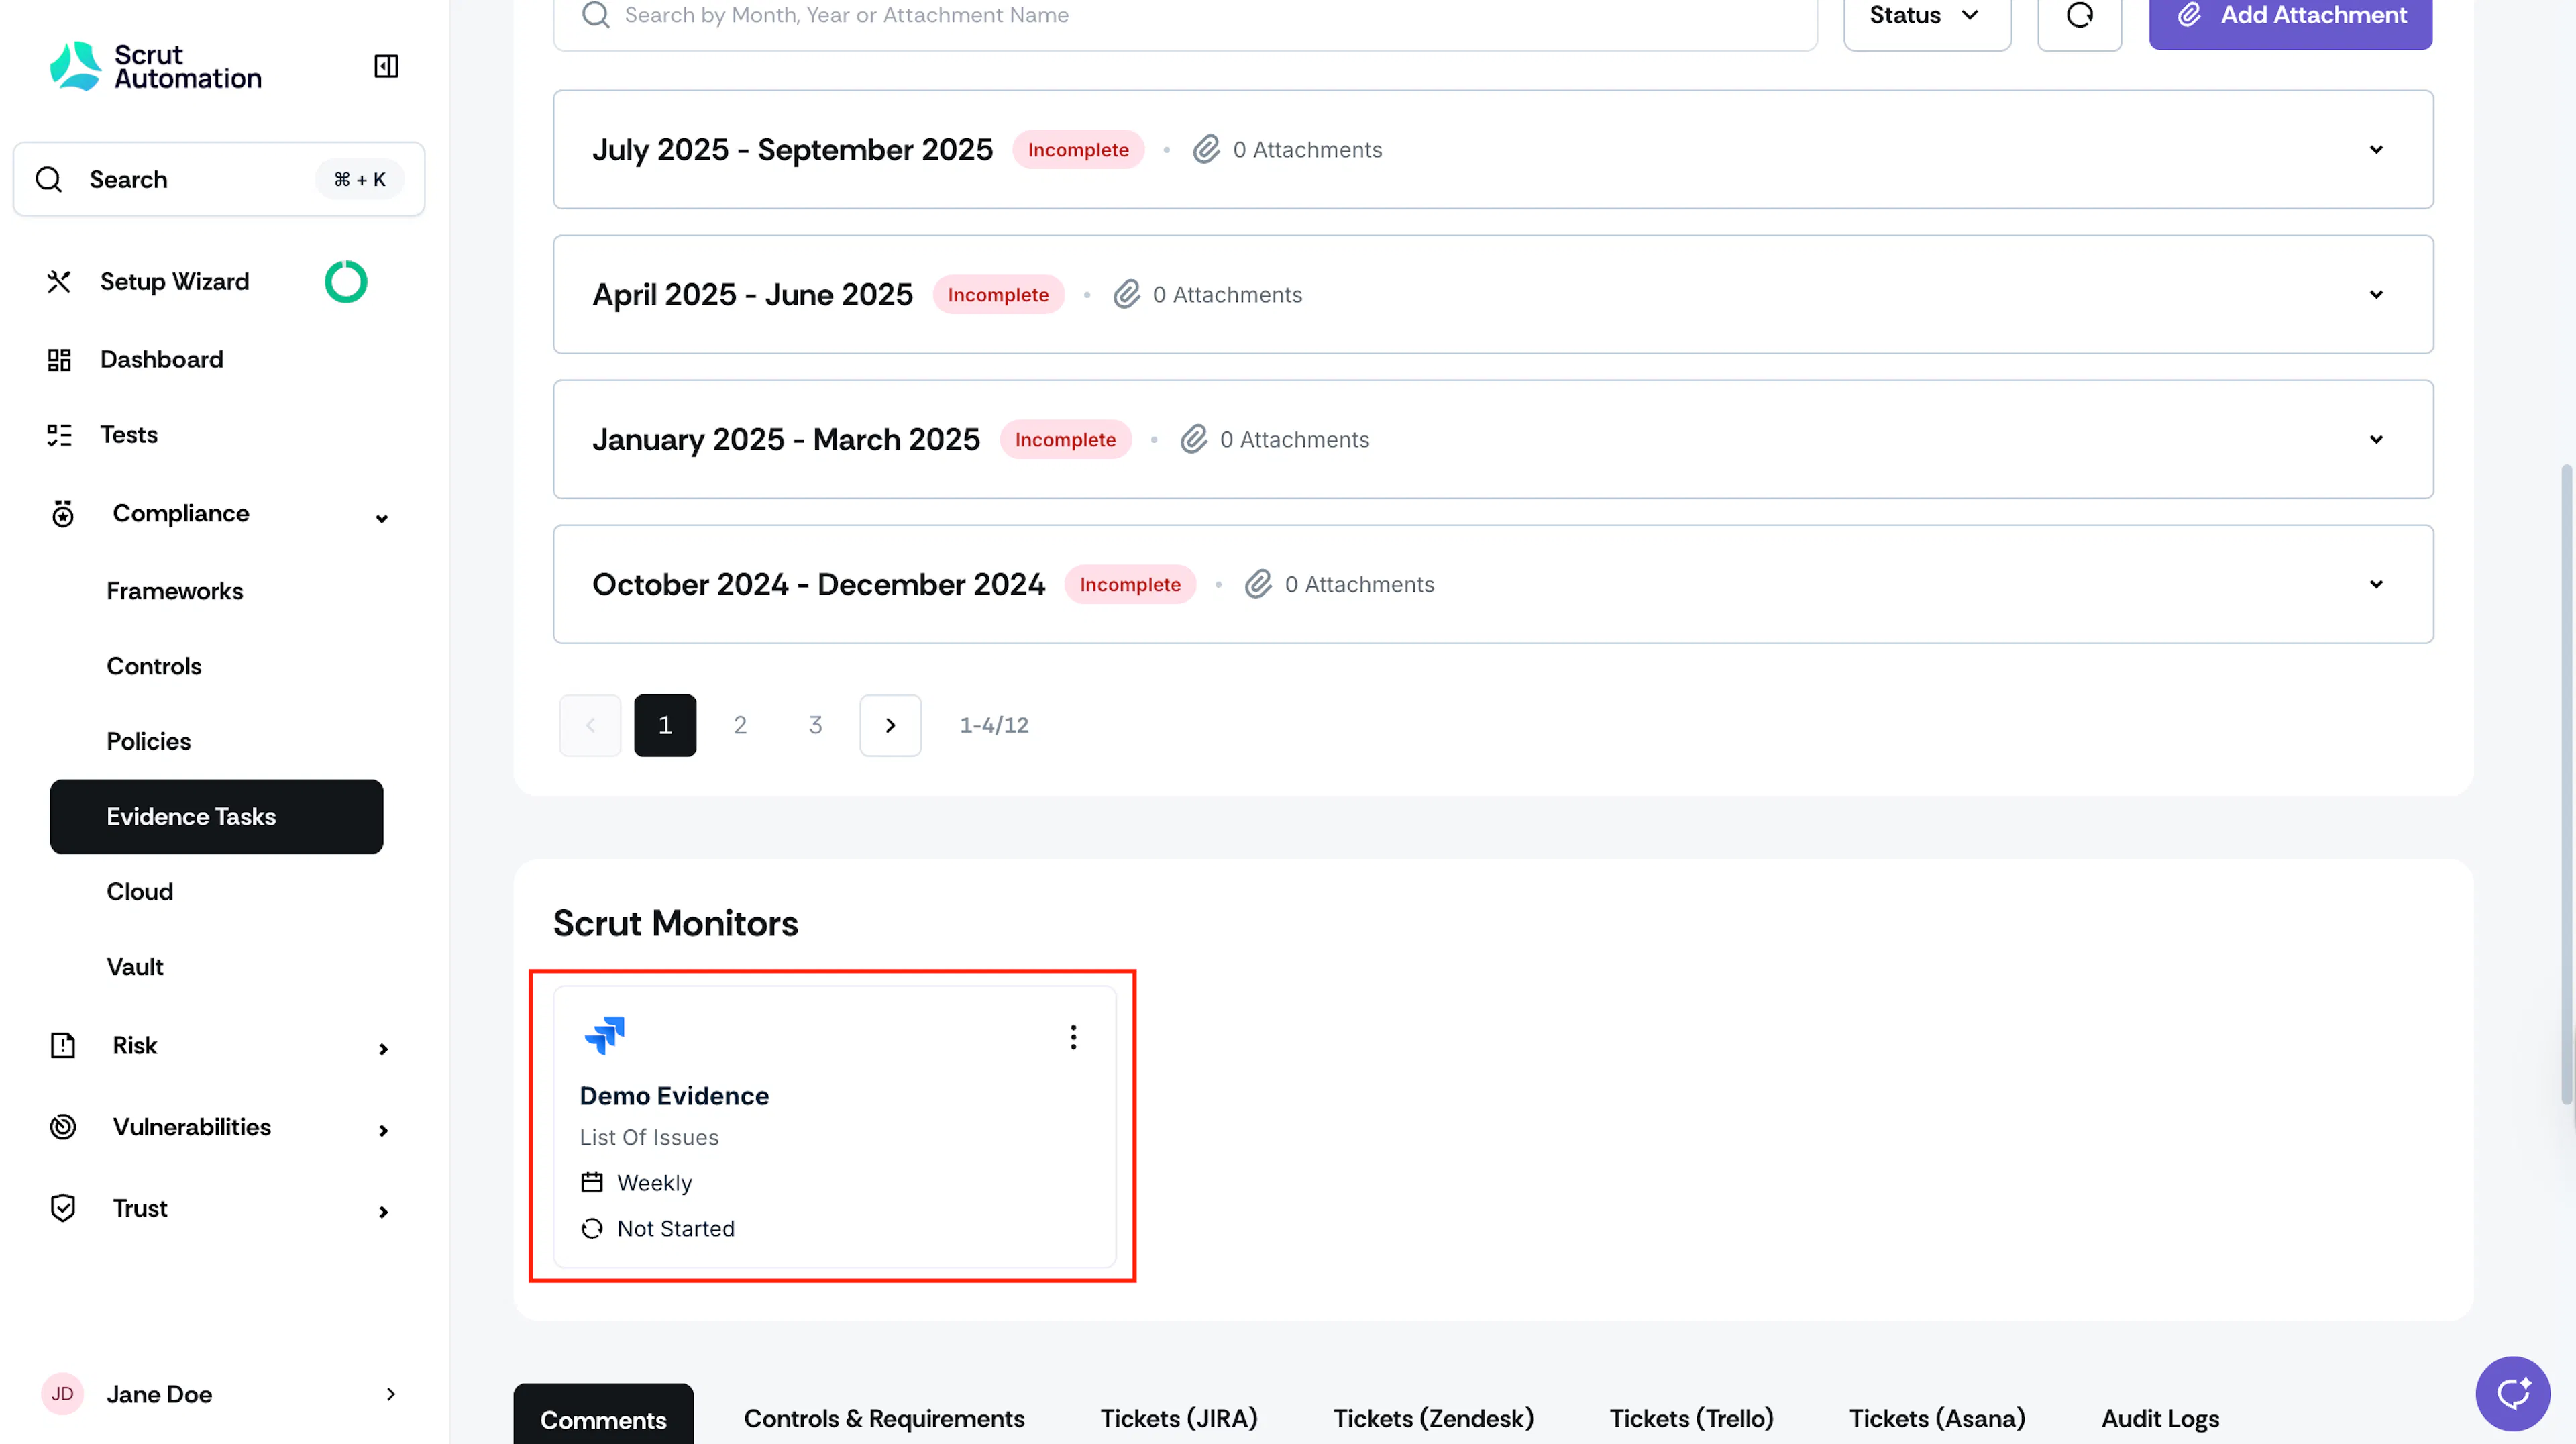
You can now see the Scrut Monitor attached to the evidence task.
What Happens Next?
Once you’ve configured the Scrut Monitor, it will automatically:
- Run your JQL query on the scheduled cadence
- Generate timestamped files (e.g., jira_issues_20252209.csv)
- Attach the generated file to your evidence task
You can find the attached file in the Attachments section of the evidence details page. Click on it to open and view its contents.
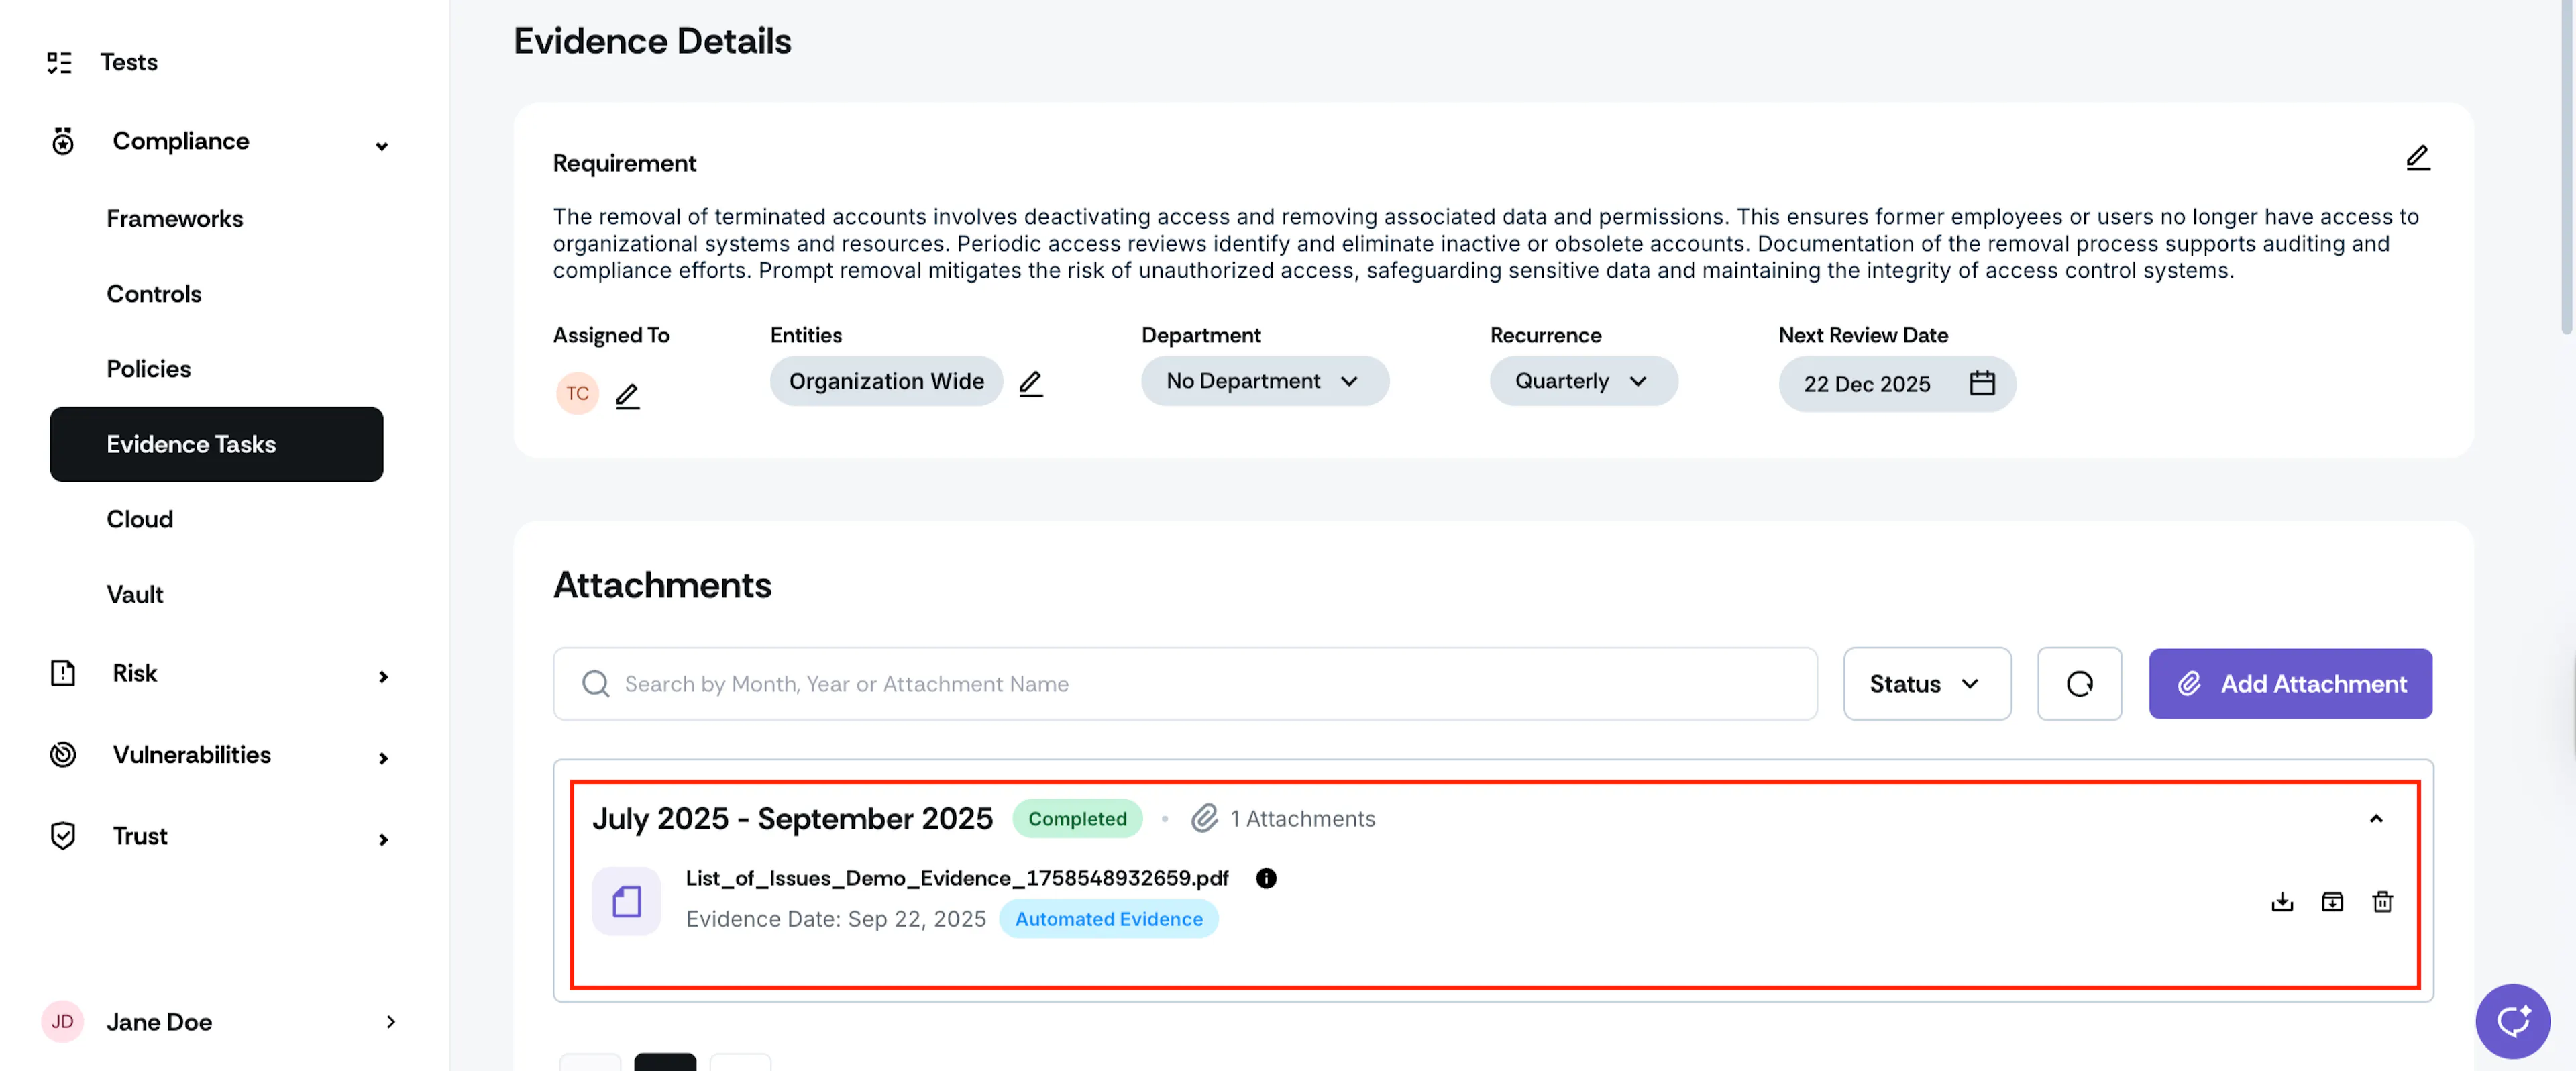
The Automated Evidence tag indicates that the evidence type is automated, to distinguish from manual evidence.