

Cloud Tests: Walkthrough
In this article, we provide a detailed walkthrough of navigating the cloud module and explain its functionality.
The Cloud Module is Scrut’s automated security and compliance monitoring solution for your cloud infrastructure. It continuously scans and evaluates your cloud resources across AWS, Azure, and Google Cloud Platform (GCP) to ensure they meet security best practices and compliance requirements. It transforms cloud security from a manual, time-consuming process into an automated, continuous practice that scales with your infrastructure.
Why Cloud Monitoring Matters
Your cloud infrastructure is the backbone of your digital operations and is often a target for security incidents. Without continuous, automated monitoring, security gaps, misconfigurations, and compliance violations can go undetected, exposing your operations to significant risks.
Scrut’s cloud module helps you:
- Maintain compliance with industry frameworks and standards
- Identify security gaps before they can be exploited
- Ensure operational health across all cloud environments
What Does Scrut Monitor in Your Cloud Infrastructure
Scrut continuously tracks critical infrastructure components and security configurations across your cloud environment. Some key metrics that Scrut monitors include:
Security and Compliance
- Security group configurations: Verify network access controls
- Encryption settings: Ensure data protection standards
- Identity and access management: Monitor permissions and roles
- Logging and monitoring: Validate audit trail configurations
- Backup and disaster recovery: Confirm business continuity measures
Performance and Resource Metrics
- CPU and memory utilization: Ensure resources are optimally configured
- Database latency and write capacity: Monitor database performance
- Load balancer health and latency: Track traffic distribution efficiency
- Storage usage and connection limits: Prevent resource exhaustion
These comprehensive checks help you monitor your cloud resources 24 × 7, alerting you to any compliance and security gaps, before they impact your business.
Supported Providers in the Cloud Module
Currently, Scrut provides full testing capabilities for the following cloud providers:
- AWS (Amazon Web Services)
- Microsoft Azure
- GCP (Google Cloud Platform)
What is a Cloud Test?
In Scrut, a Cloud Test is a specific rule or assessment applied to your cloud resources to verify their compliance with predefined security standards and best practices, such as the CIS Benchmark. These tests scan your cloud environment to identify potential security risks, vulnerabilities, and non-compliance issues.
Once you integrate your cloud provider (AWS, Azure, or GCP) with Scrut, it automatically performs daily scans of your cloud resources using predefined rules and criteria. These rules are designed to align with industry standards, regulatory requirements, and best practices. Each test analyzes your cloud configuration and settings to ensure they comply with these guidelines.
Benefits
Continuous Compliance
- Automated testing against your purchased frameworks, such as SOC 2, ISO 27001, HIPAA, etc.
- Automated evidence collection for audits
- Real-time compliance status tracking
Proactive Risk Management
- Early detection of security misconfigurations
- Prevention of unauthorized access
- Identification of exposed sensitive data
- Monitoring of encryption and backup status
Operational Efficiency
- Reduce manual security reviews
- Centralized multi-cloud visibility
- Streamlined and AI-assisted remediation workflows
Cost Optimization
- Identify over-provisioned resources
- Detect unused or underutilized assets
- Prevent resource exhaustion incidents
- Optimize cloud spending through better visibility
Types of Cloud Tests
Tests can encompass various aspects of cloud security and compliance. Some common test types in Scrut include:
- Configuration Tests: These tests evaluate whether your cloud resources are configured in alignment with recommended security settings. For example, they might assess whether encryption is enabled, access controls are properly configured, and data storage is adequately protected.
- Access Control Tests: These tests examine the access controls in place for your cloud resources. They verify that only authorized users have appropriate permissions to access sensitive data or perform specific actions.
- Compliance Tests: Compliance tests evaluate whether your cloud environment meets specific compliance standards and regulations, such as the GDPR, HIPAA, or PCI DSS. These tests ensure that your cloud practices meet legal requirements.
How To Access the Cloud Module
Sign in to Scrut and click Compliance → Cloud on the left navigation panel. The Cloud module consists of four tabs:
In this guide, we take a closer look at each section, providing you with an in-depth understanding of how to use this module to achieve your compliance objectives.
Cloud Dashboard
The Cloud Dashboard provides a central interface for monitoring, assessing, and addressing misconfigurations and compliance issues in your cloud infrastructure. The results of scans from your integrated cloud providers are combined and displayed in a unified Cloud Dashboard.
Note:
The number of tests and assets scanned varies based on your integration scope. Deselecting or adding more services, regions, subscriptions, or using tag filters in the integration configuration will impact the metrics displayed in the Cloud Dashboard.
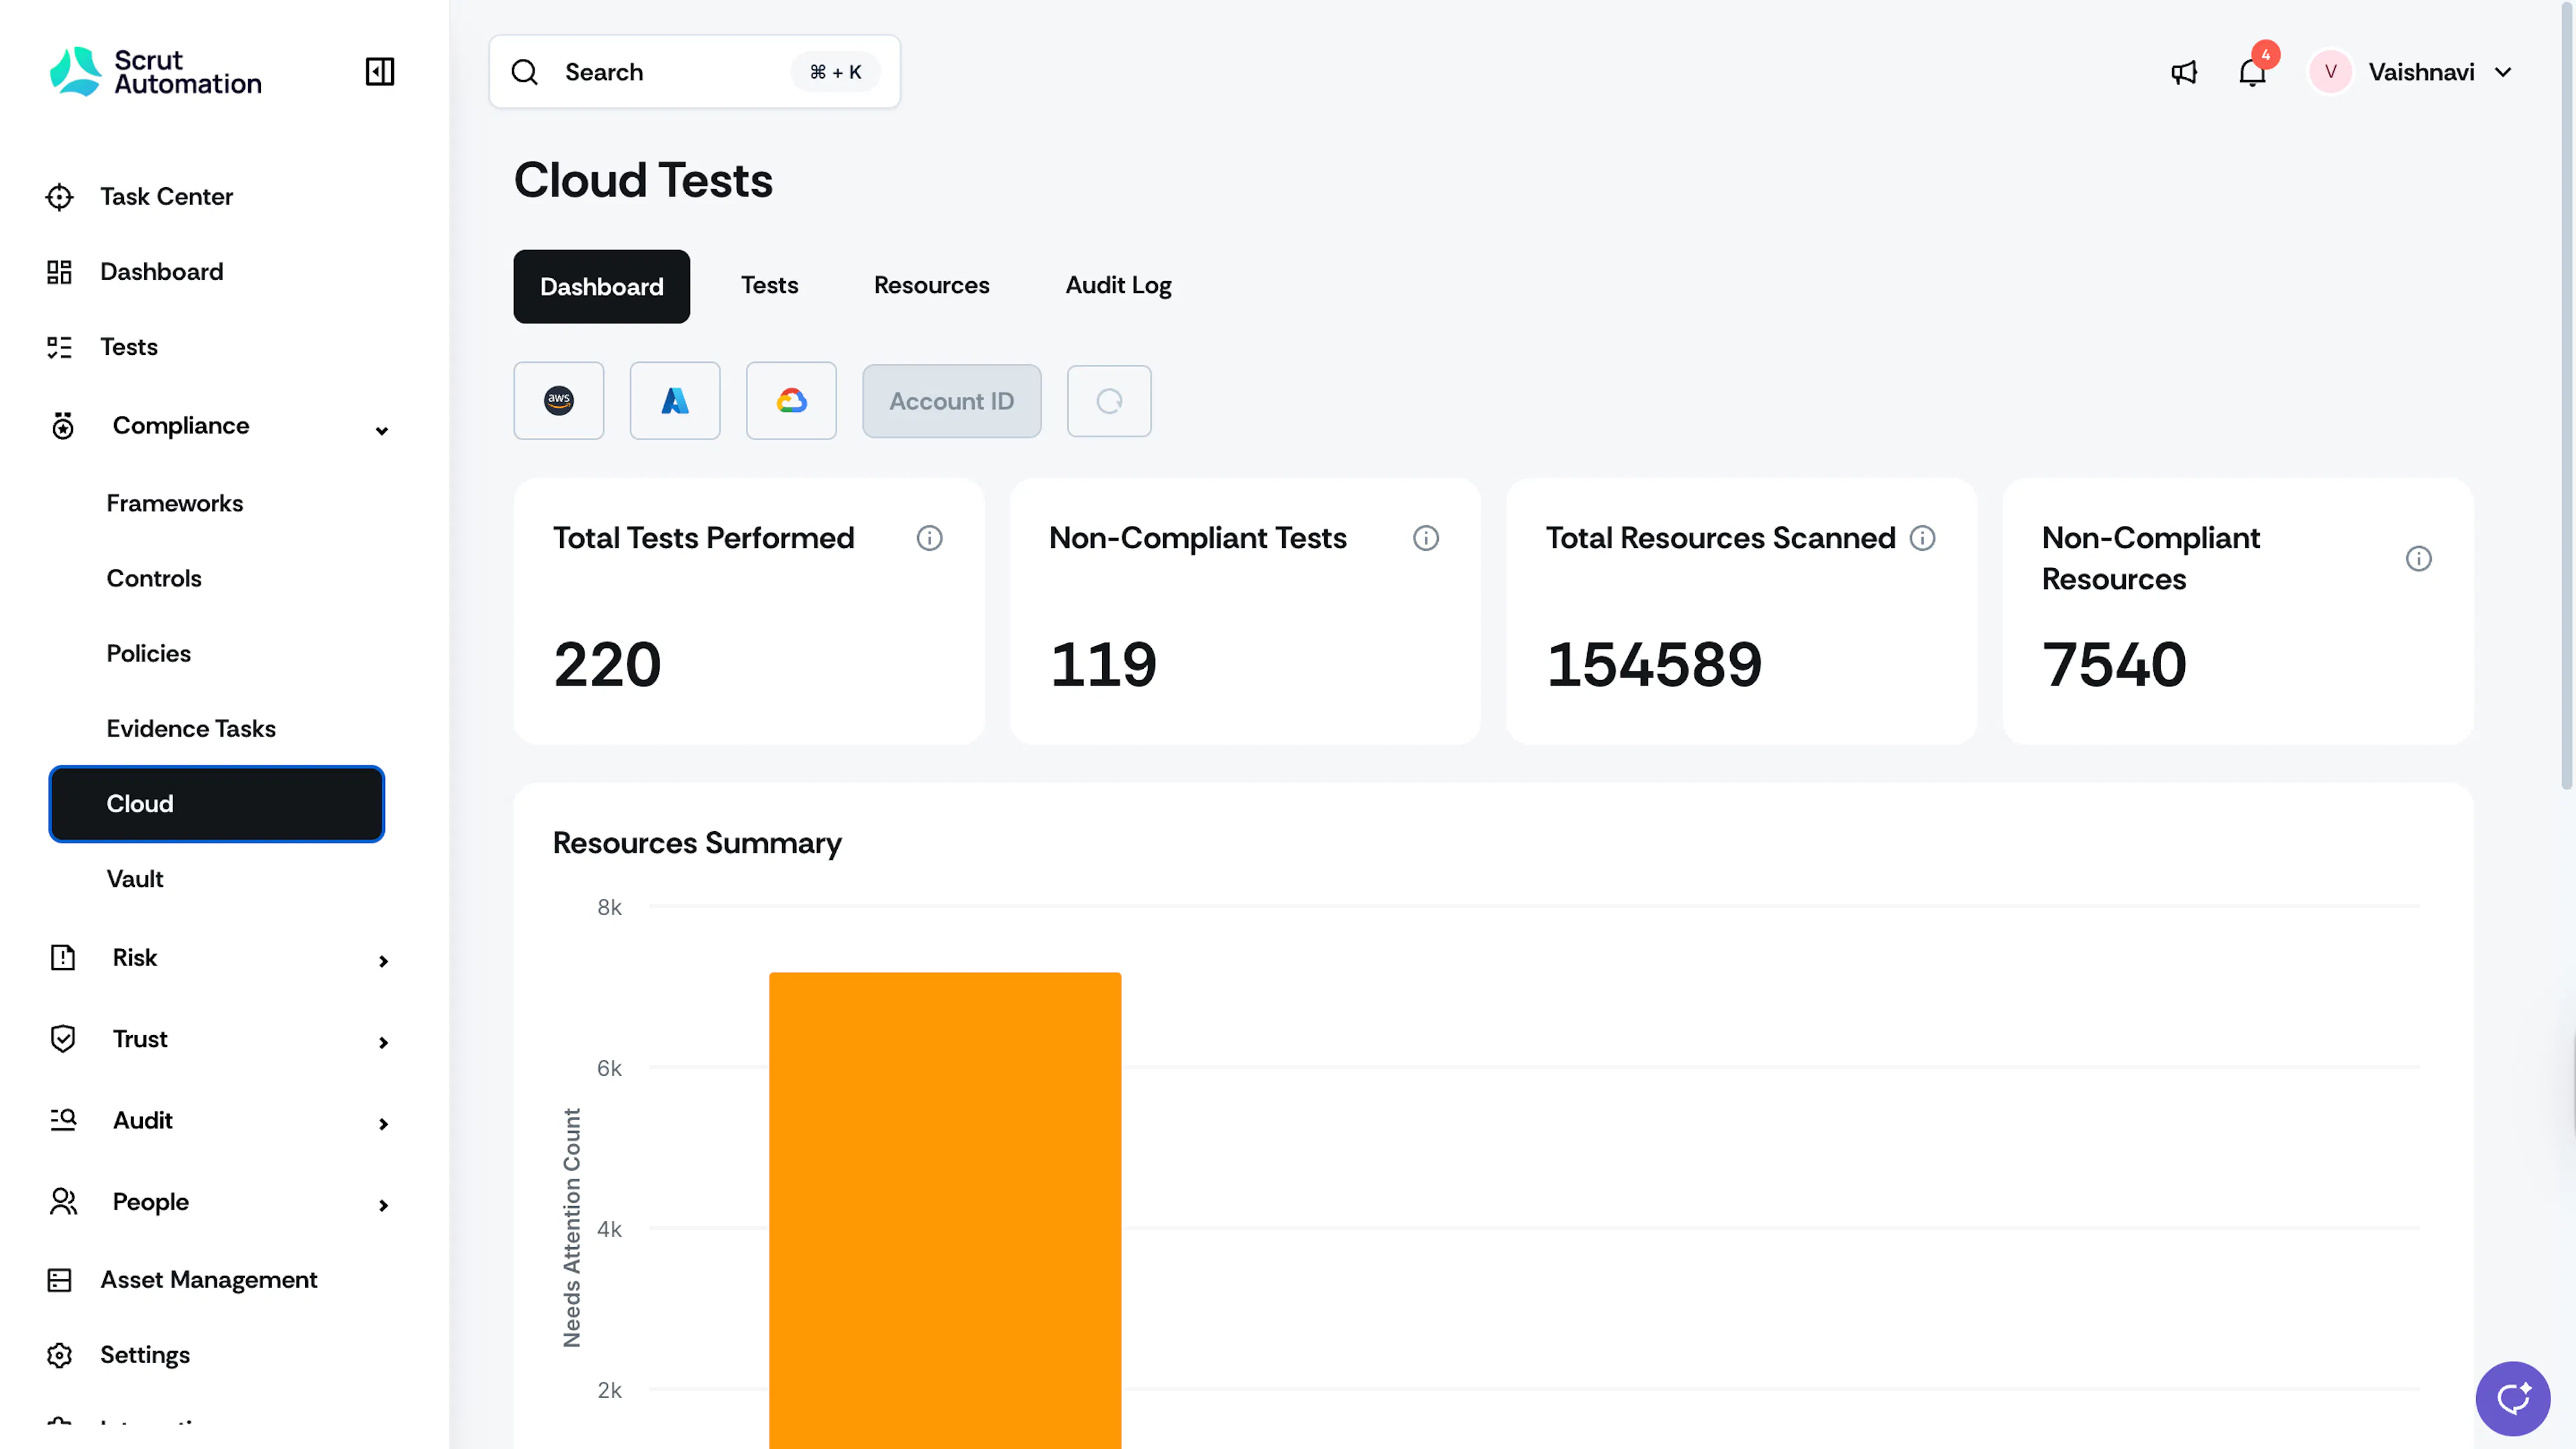
Filters
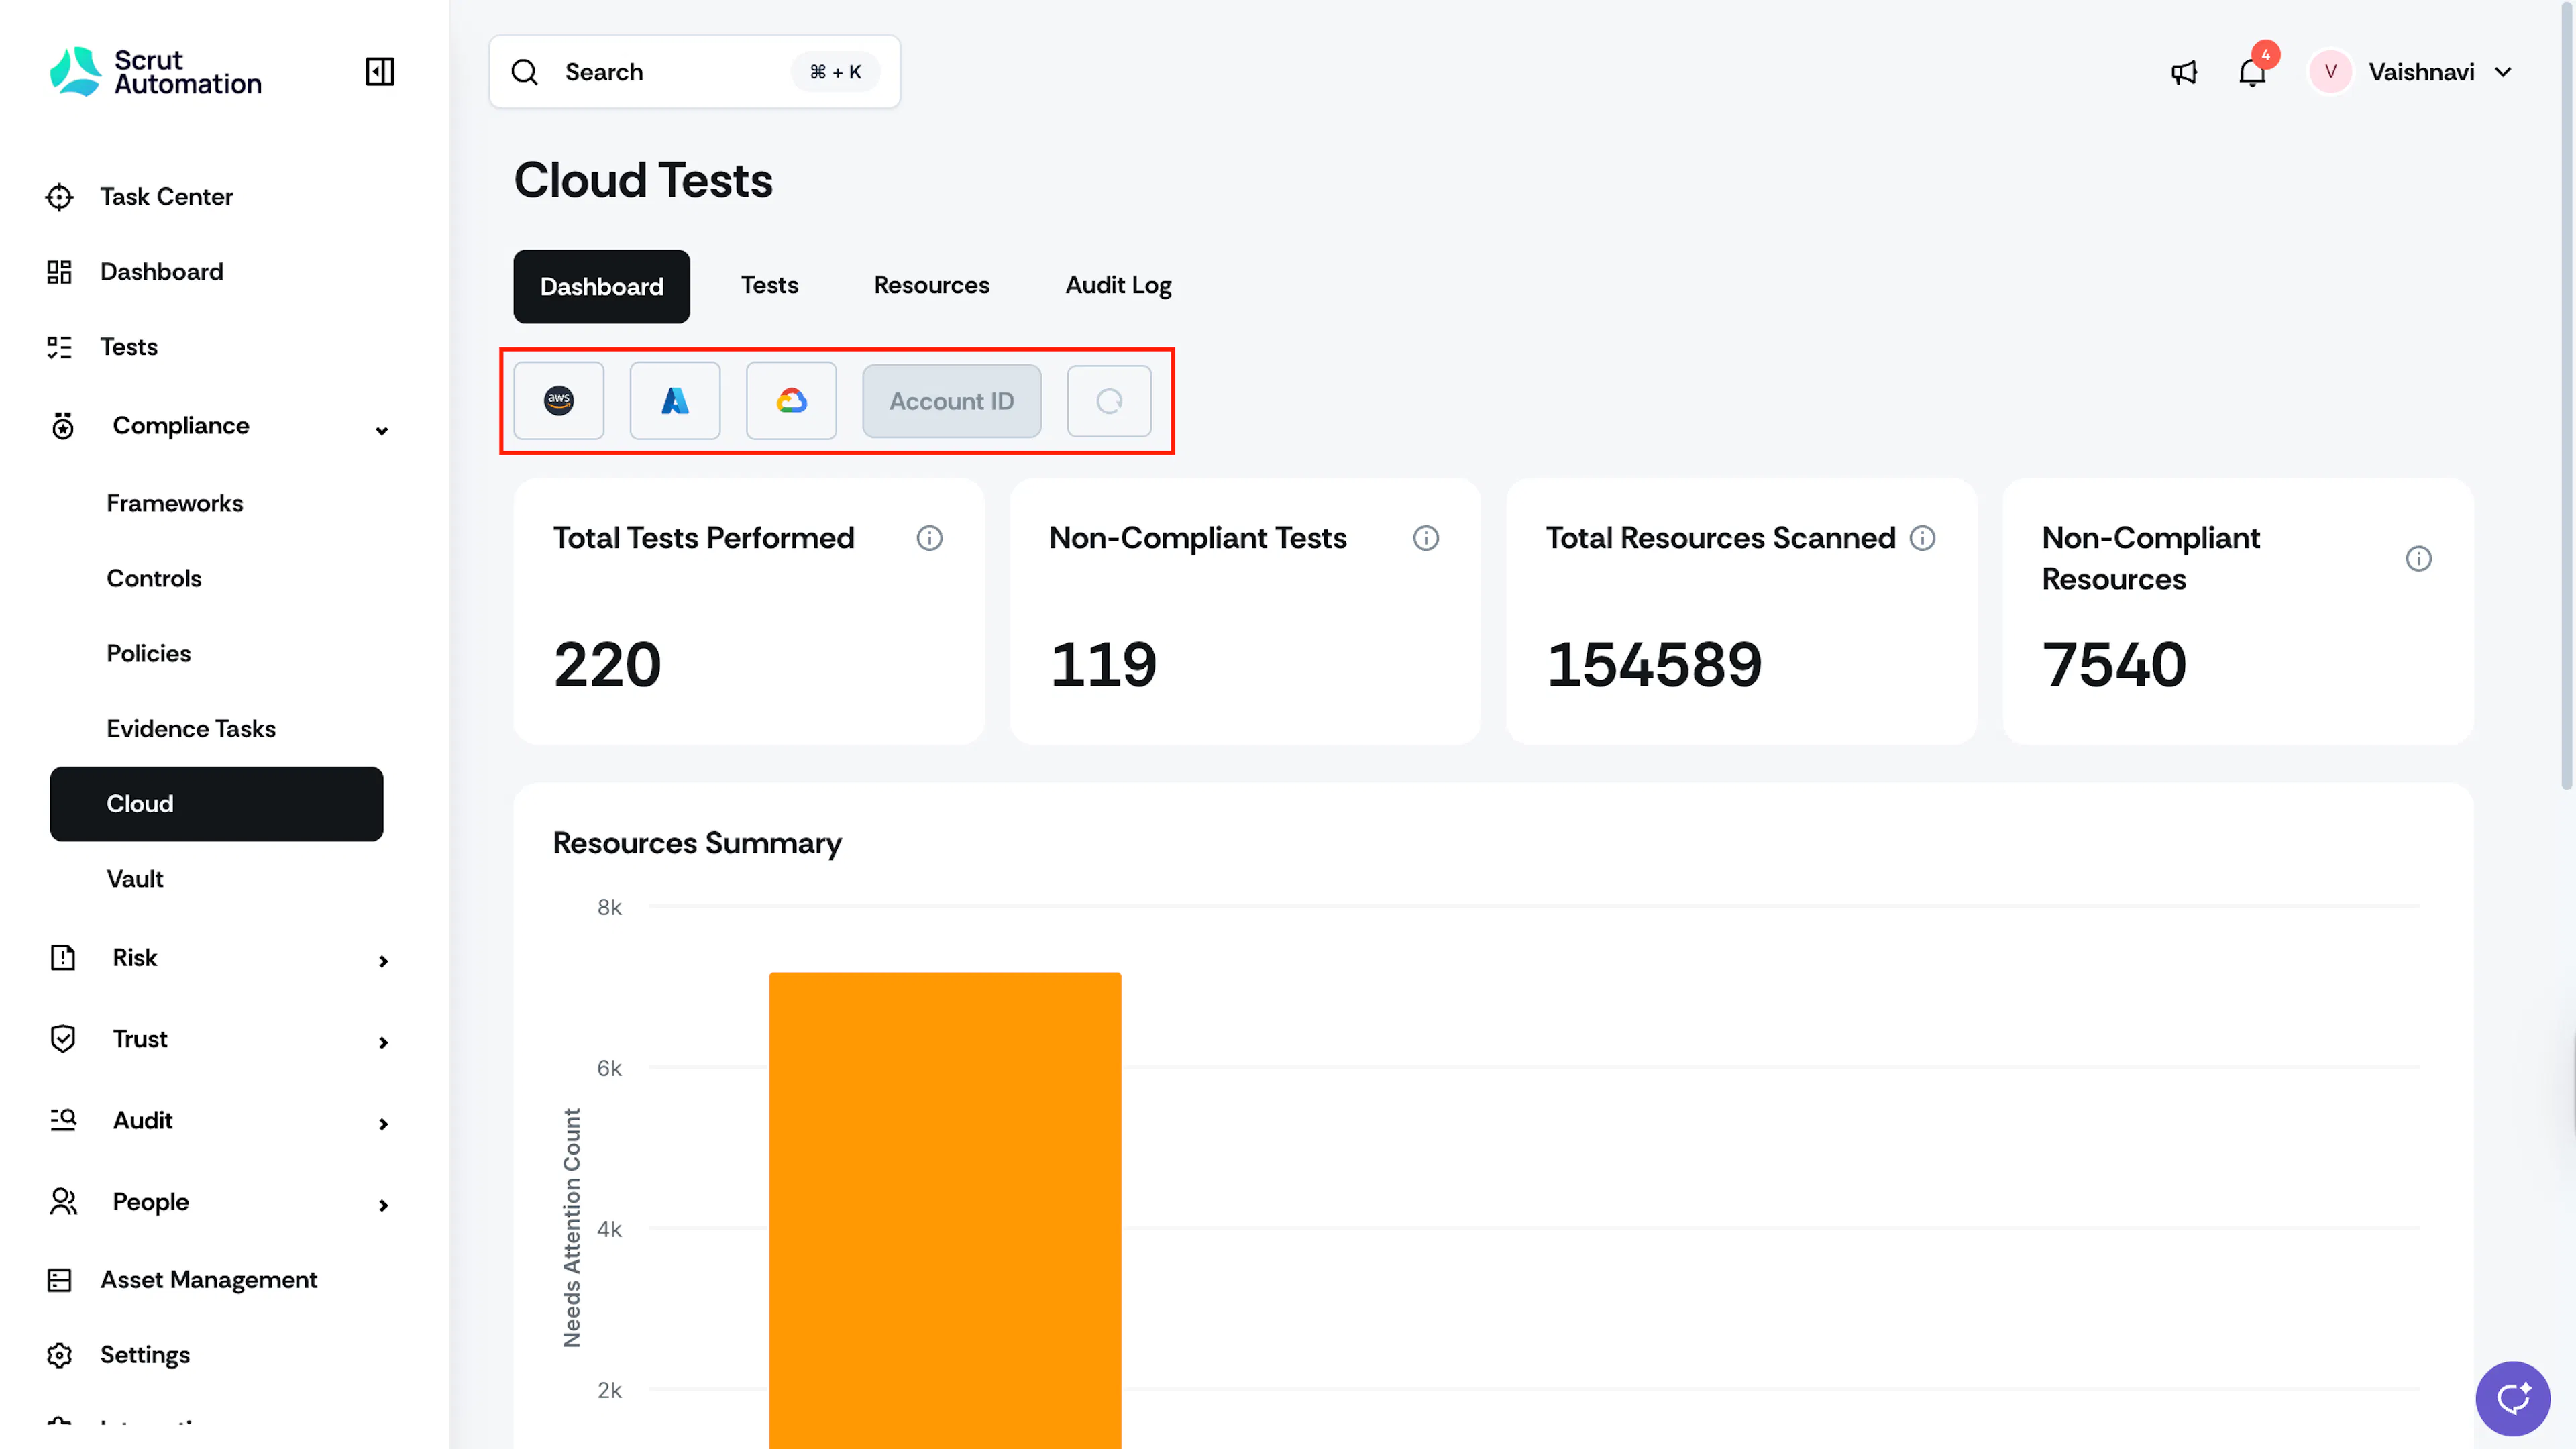
By default, the Cloud dashboard shows data from all your connected cloud providers. However, you can also drill down to view data for specific providers using the filters at the top of the dashboard. Click on the icon for AWS, Azure, or GCP to see data for each provider.
Pro Tip!
To refine results further, filter by cloud provider (AWS, Azure, GCP), then select a specific Account ID, Subscription ID, or Project ID.
AWS Account ID

Azure Subscription ID

GCP Project ID

Select the provider, and then choose a specific account, subscription, or project from the dropdown menus. To remove all filters and return to the default view, click the circular reset icon.

Key Metrics
-
Total Tests Performed: Shows the total number of security tests that Scrut has conducted in your cloud environment. This count includes tests across all three statuses: Passing, Fix Required, and Ignored.
-
Non-Compliant Tests: Displays the number of tests that have failed compliance checks. It is the count of tests with the status Fix Required.
-
Total Resources Scanned: Shows the total number of cloud resources scanned by Scrut during tests. This count includes resources across all statuses: Passing, Fix Required, and Ignored.
Note:
Each resource may be counted multiple times if assessed by multiple tests (e.g., if 5 tests access the same resource, the Total Assets Scanned count increases by 5).
-
Non-Compliant Resources: The number of resources that failed compliance checks. It is the count of assets with the status Needs Attention.

Pro Tip!
You can click on the metric cards. When you click a card, you will see related data. For instance, if you click the Non-Compliant Tests card, Scrut will take you to the Tests tab with the Non-Compliant Tests filter on.
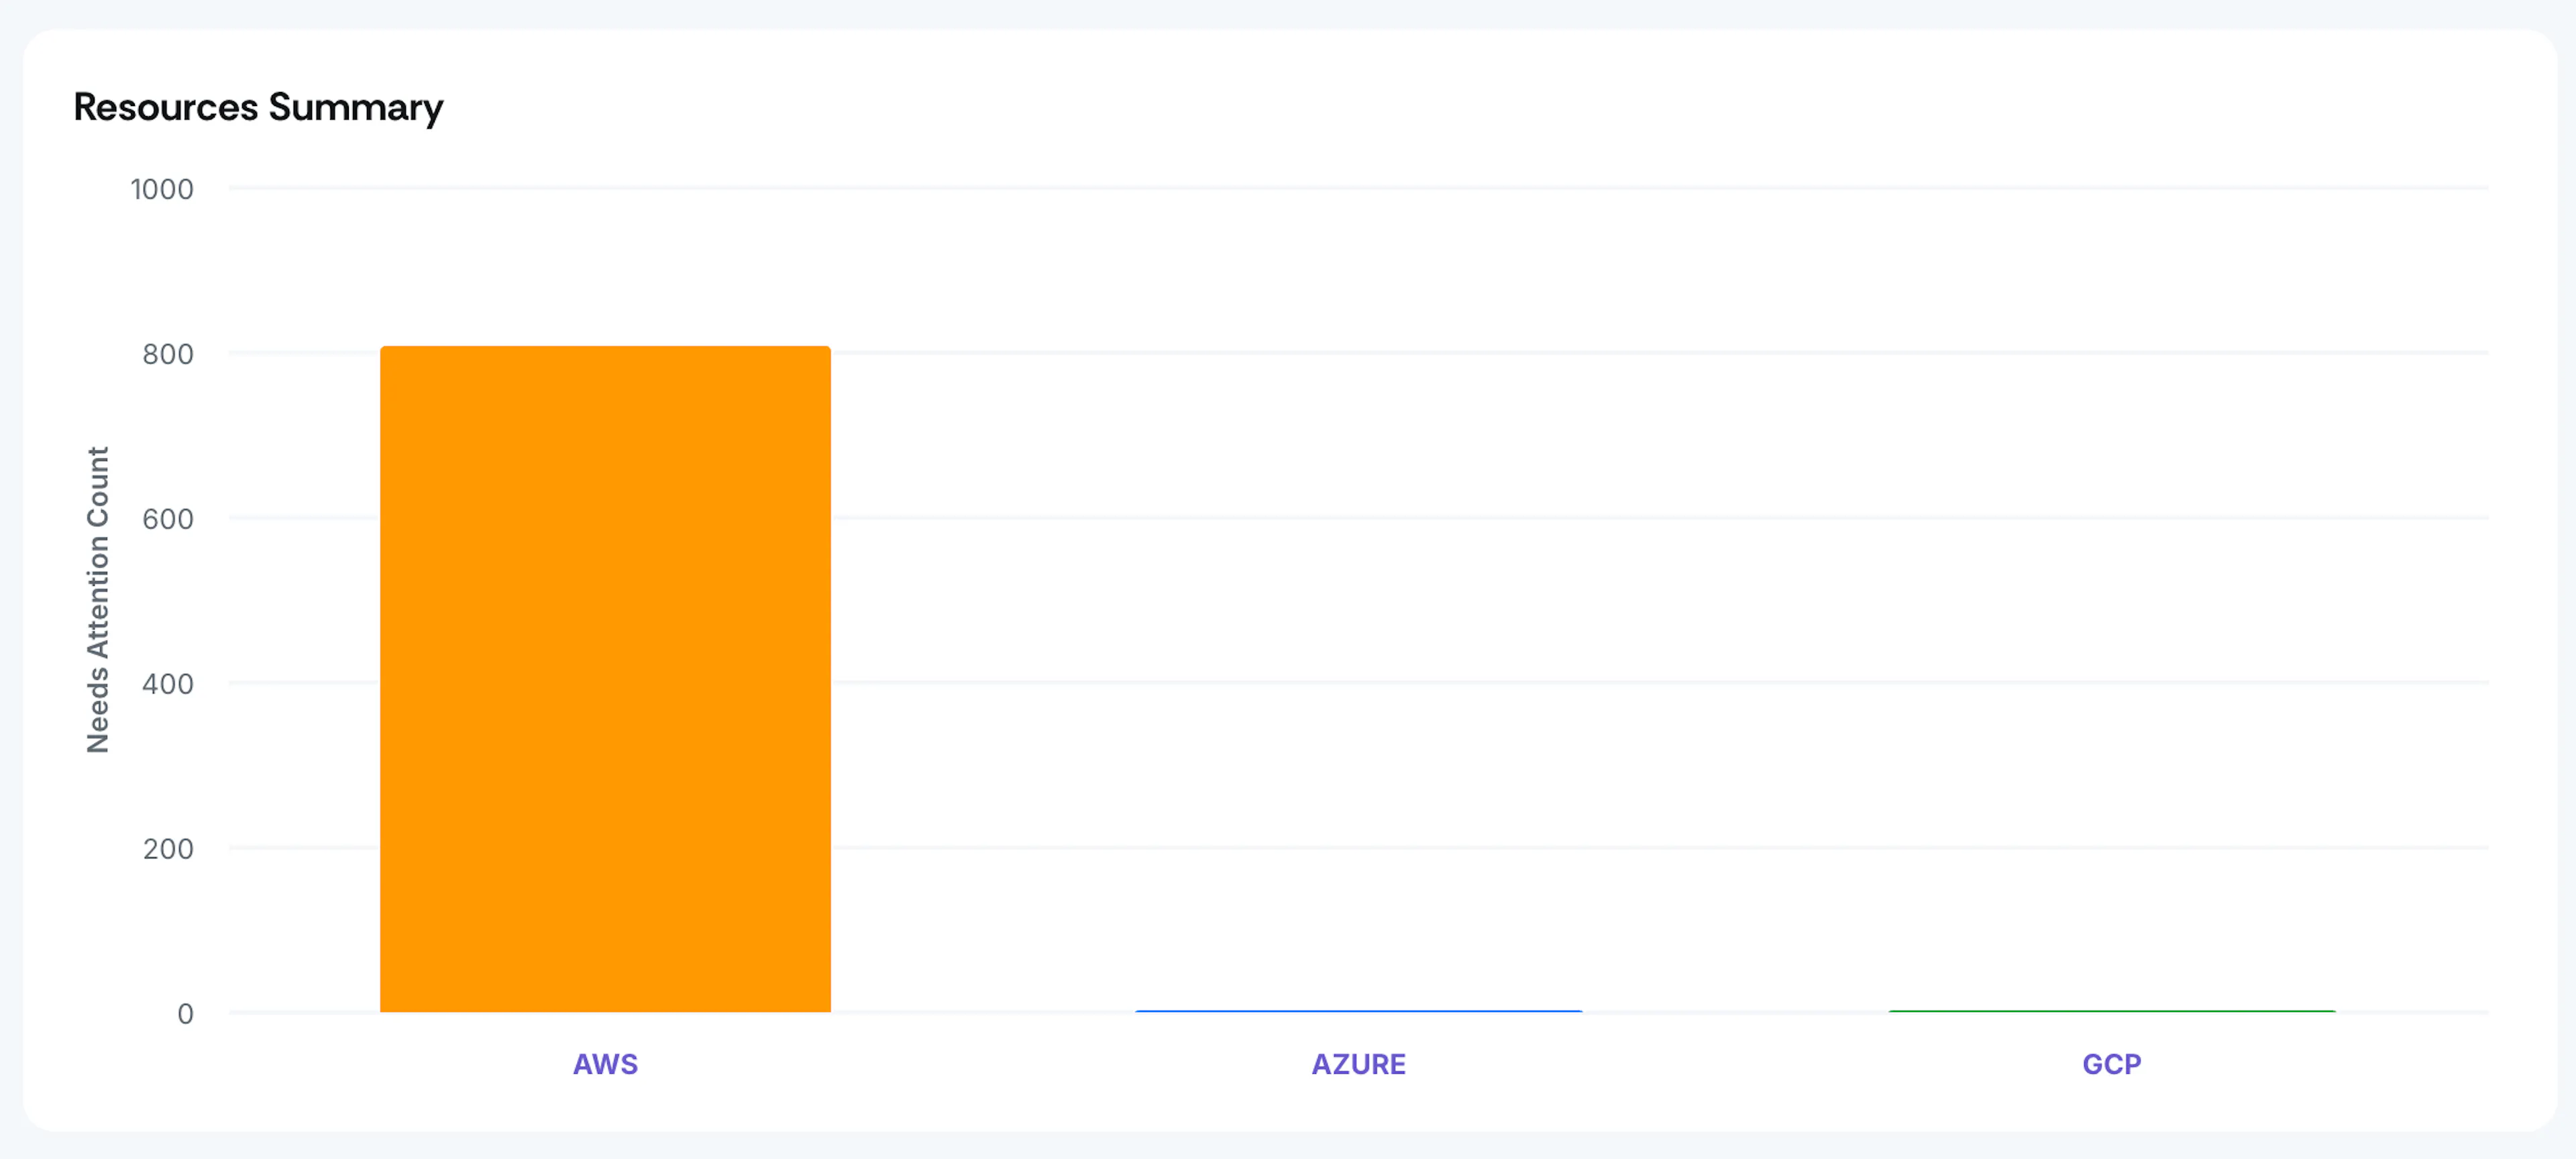
Resources Summary
This bar chart provides a snapshot of resources with the status Needs Attention across cloud providers. It helps you quickly identify which cloud provider requires the most attention, enabling you to prioritize remediation efforts effectively. It also helps you understand your overall security exposure by provider.
Resources Flagged
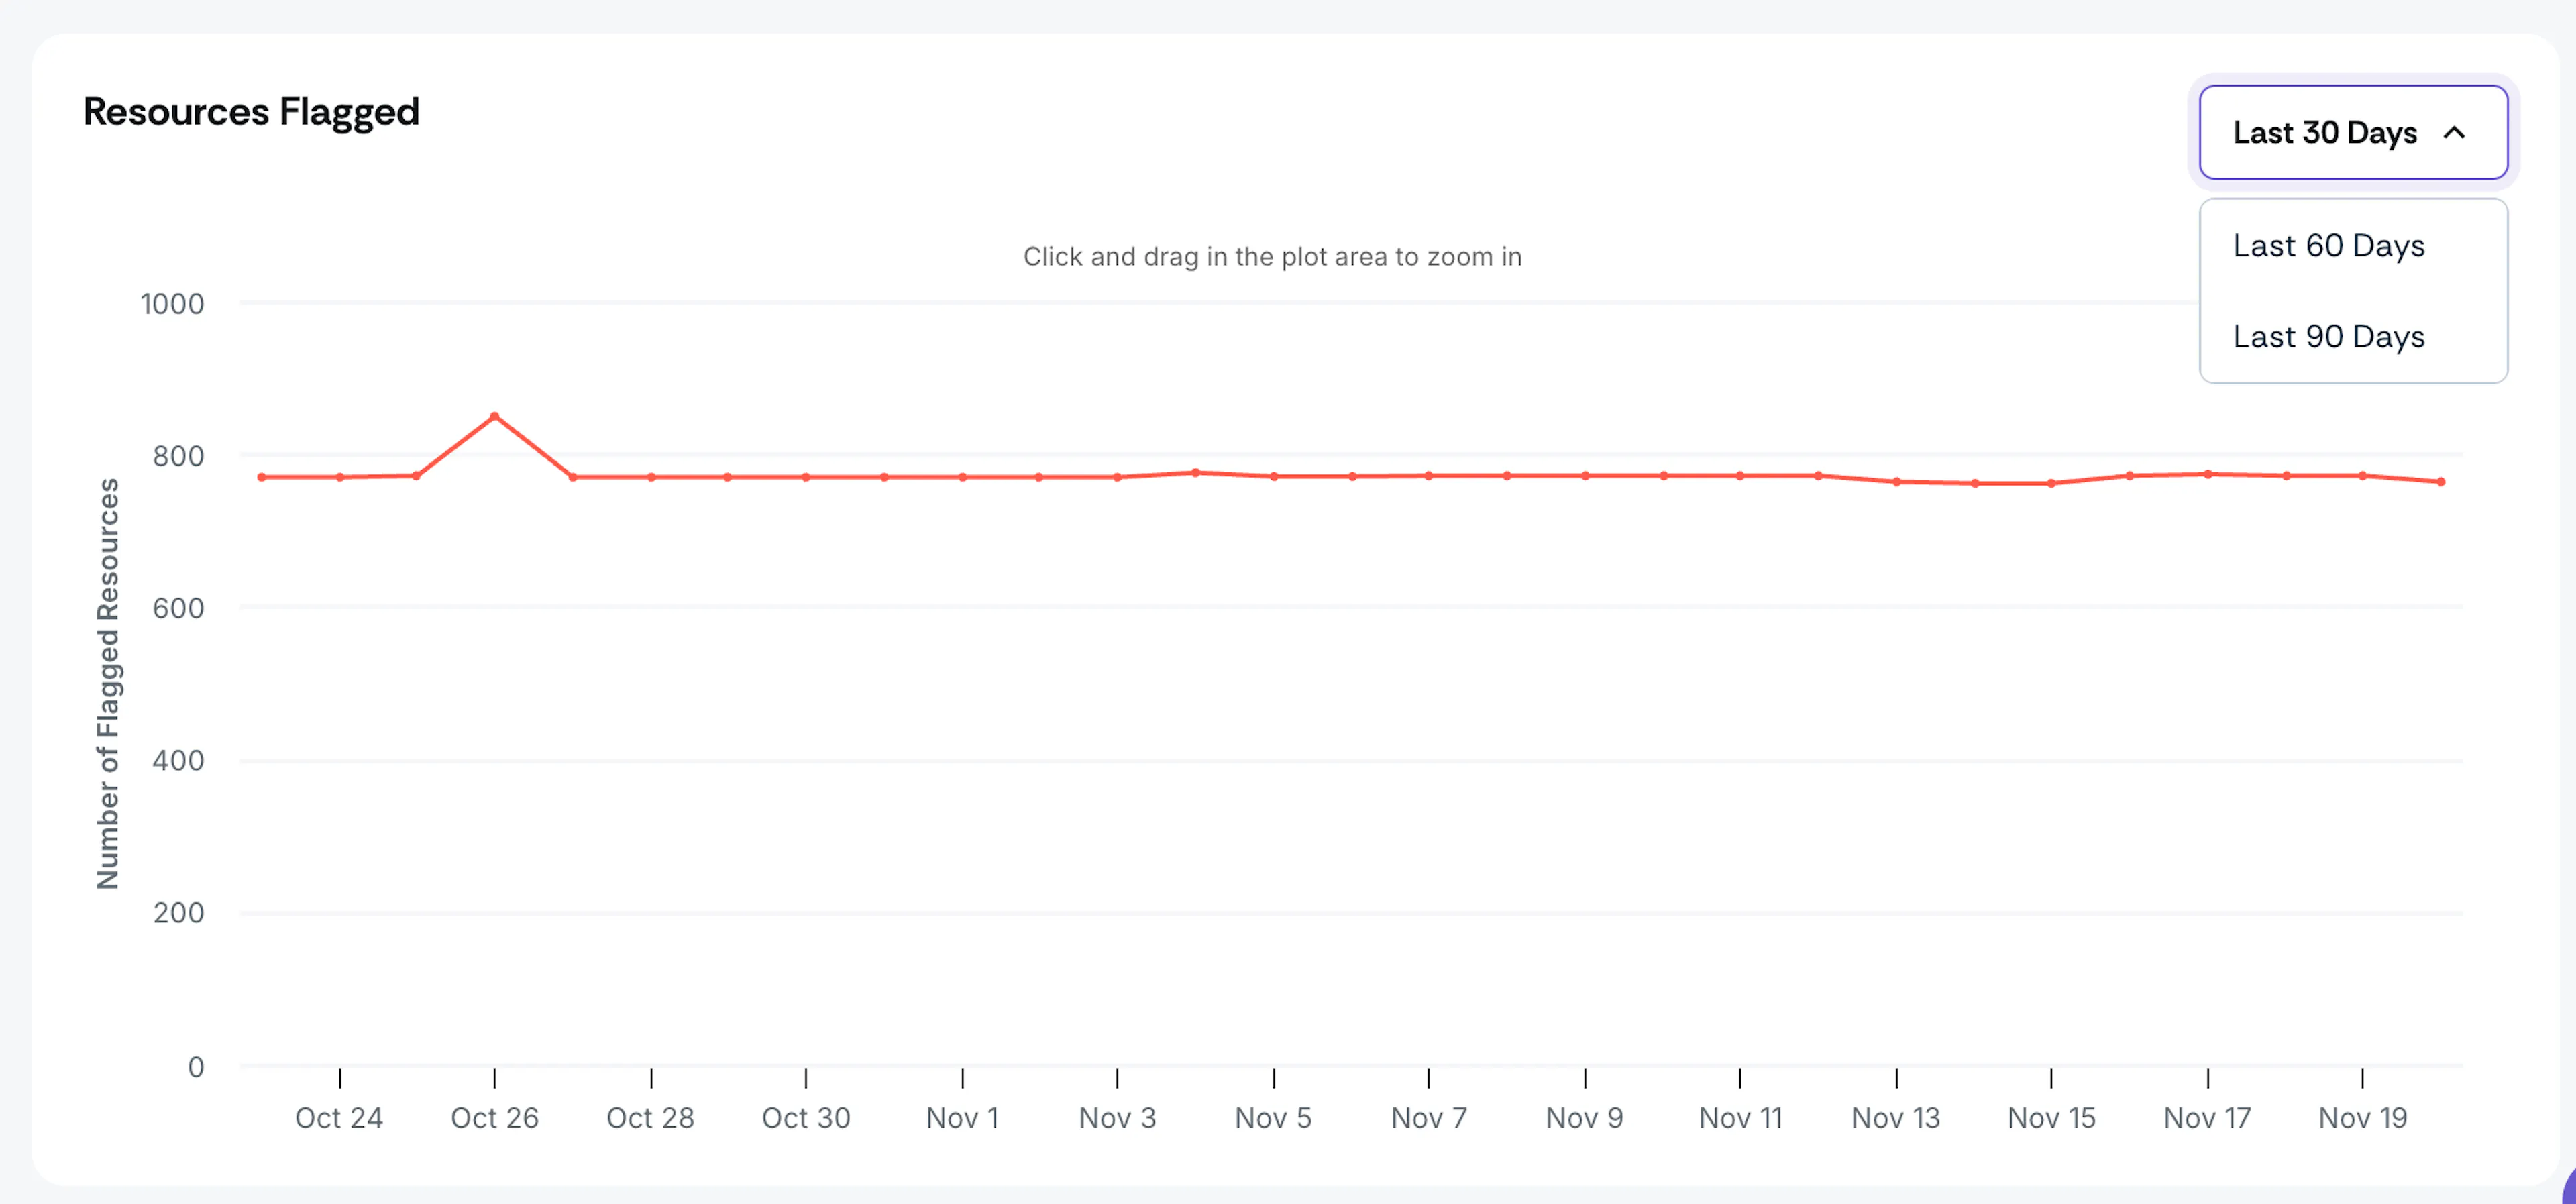
This time-series graph tracks the number of non-compliant assets flagged over time. This chart helps you identify patterns in your compliance over time. For example, you can see the immediate effects of configuration changes or new deployments. You can also use it to monitor if your remediation efforts are reducing flagged resources over time.
Use the dropdown (Last 30/60/90 days) to adjust the analysis period. You can also click and drag the plot area to zoom in.
Tests Tab
The Tests tab in the Cloud module lists all tests Scrut has run on your cloud infrastructure.
Filters
Just like the dashboard, the Tests tab also features filters that let you drill down to view tests by specific cloud providers. To further refine results, use the Services filter to view tests for specific services in your cloud infrastructure. For example, if you select AWS, you can view tests for specific services such as EC2, IAM, S3, etc.
Note:
Only the Services configured in the integration scope will be shown in the filter.
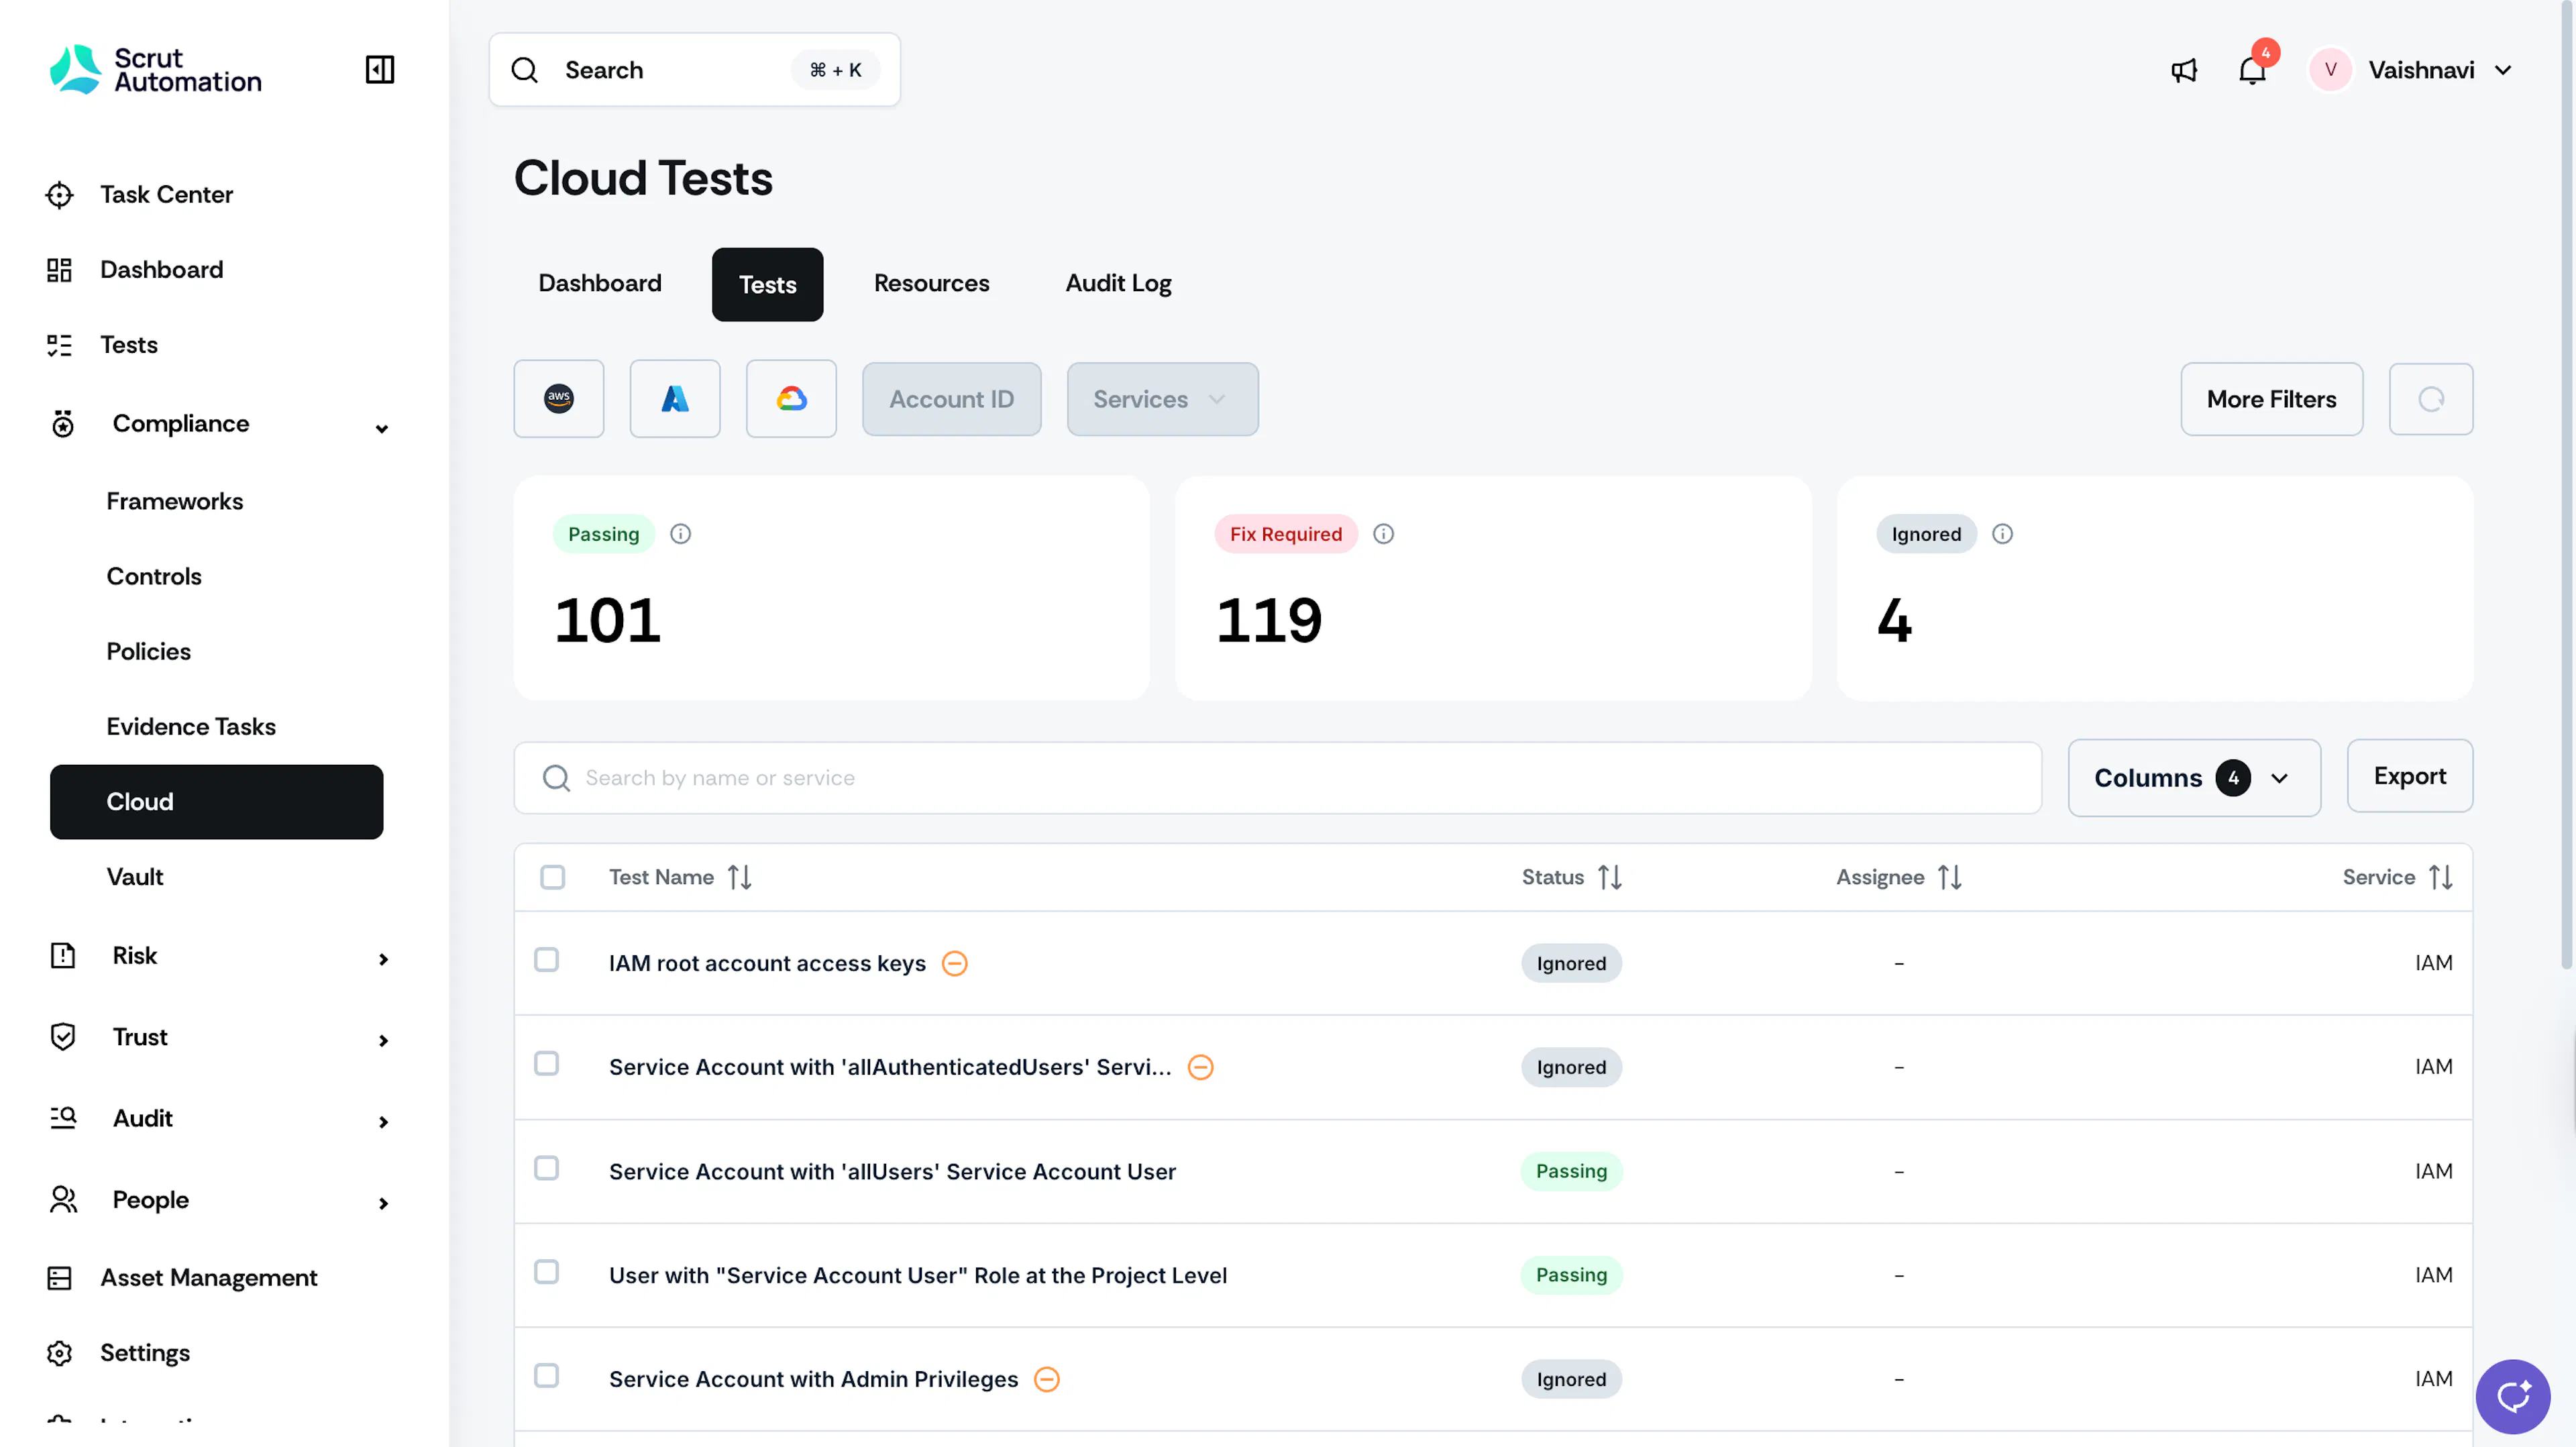
Cloud Test Statuses
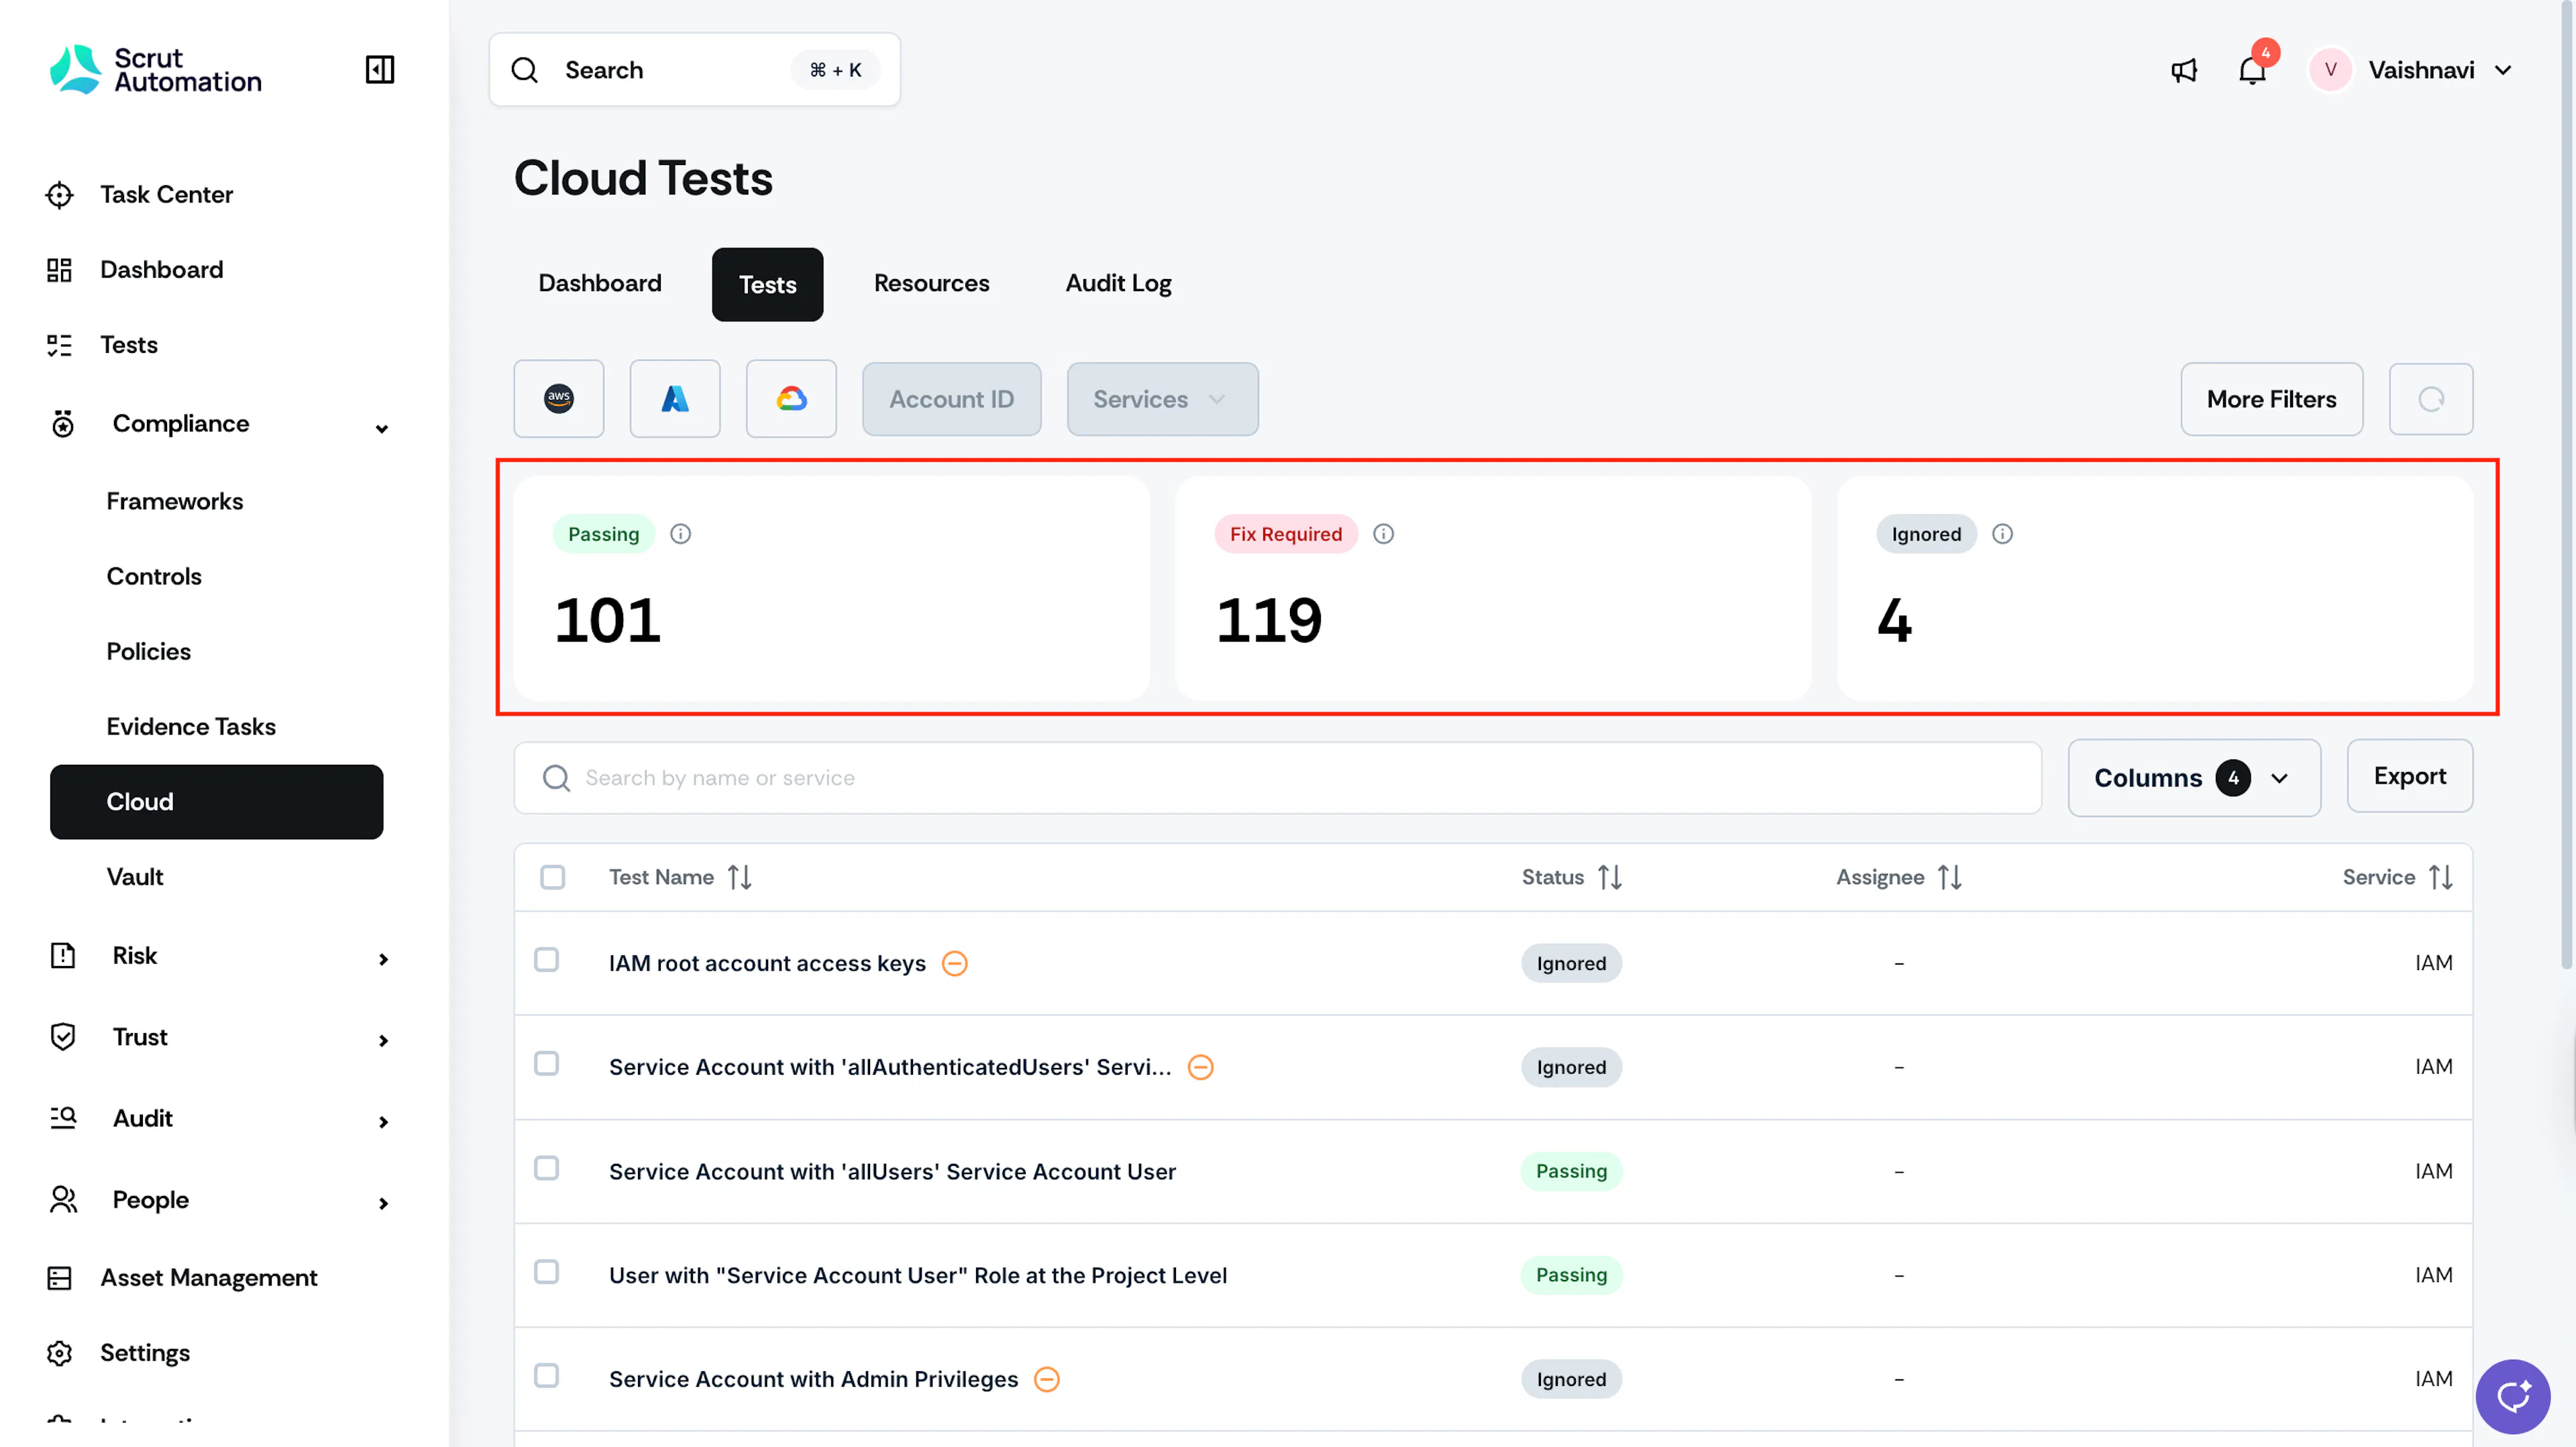
This tab categorizes test findings into three statuses, including:
- Fix Required: Tests that require your attention. View the remediation steps and resolve these issues.
- Passing: Tests that have successfully passed and are compliant with your compliance requirements.
- Ignored: Tests that you have marked as ignored, often for cases where the risk is accepted due to specific business requirements.
Test Table
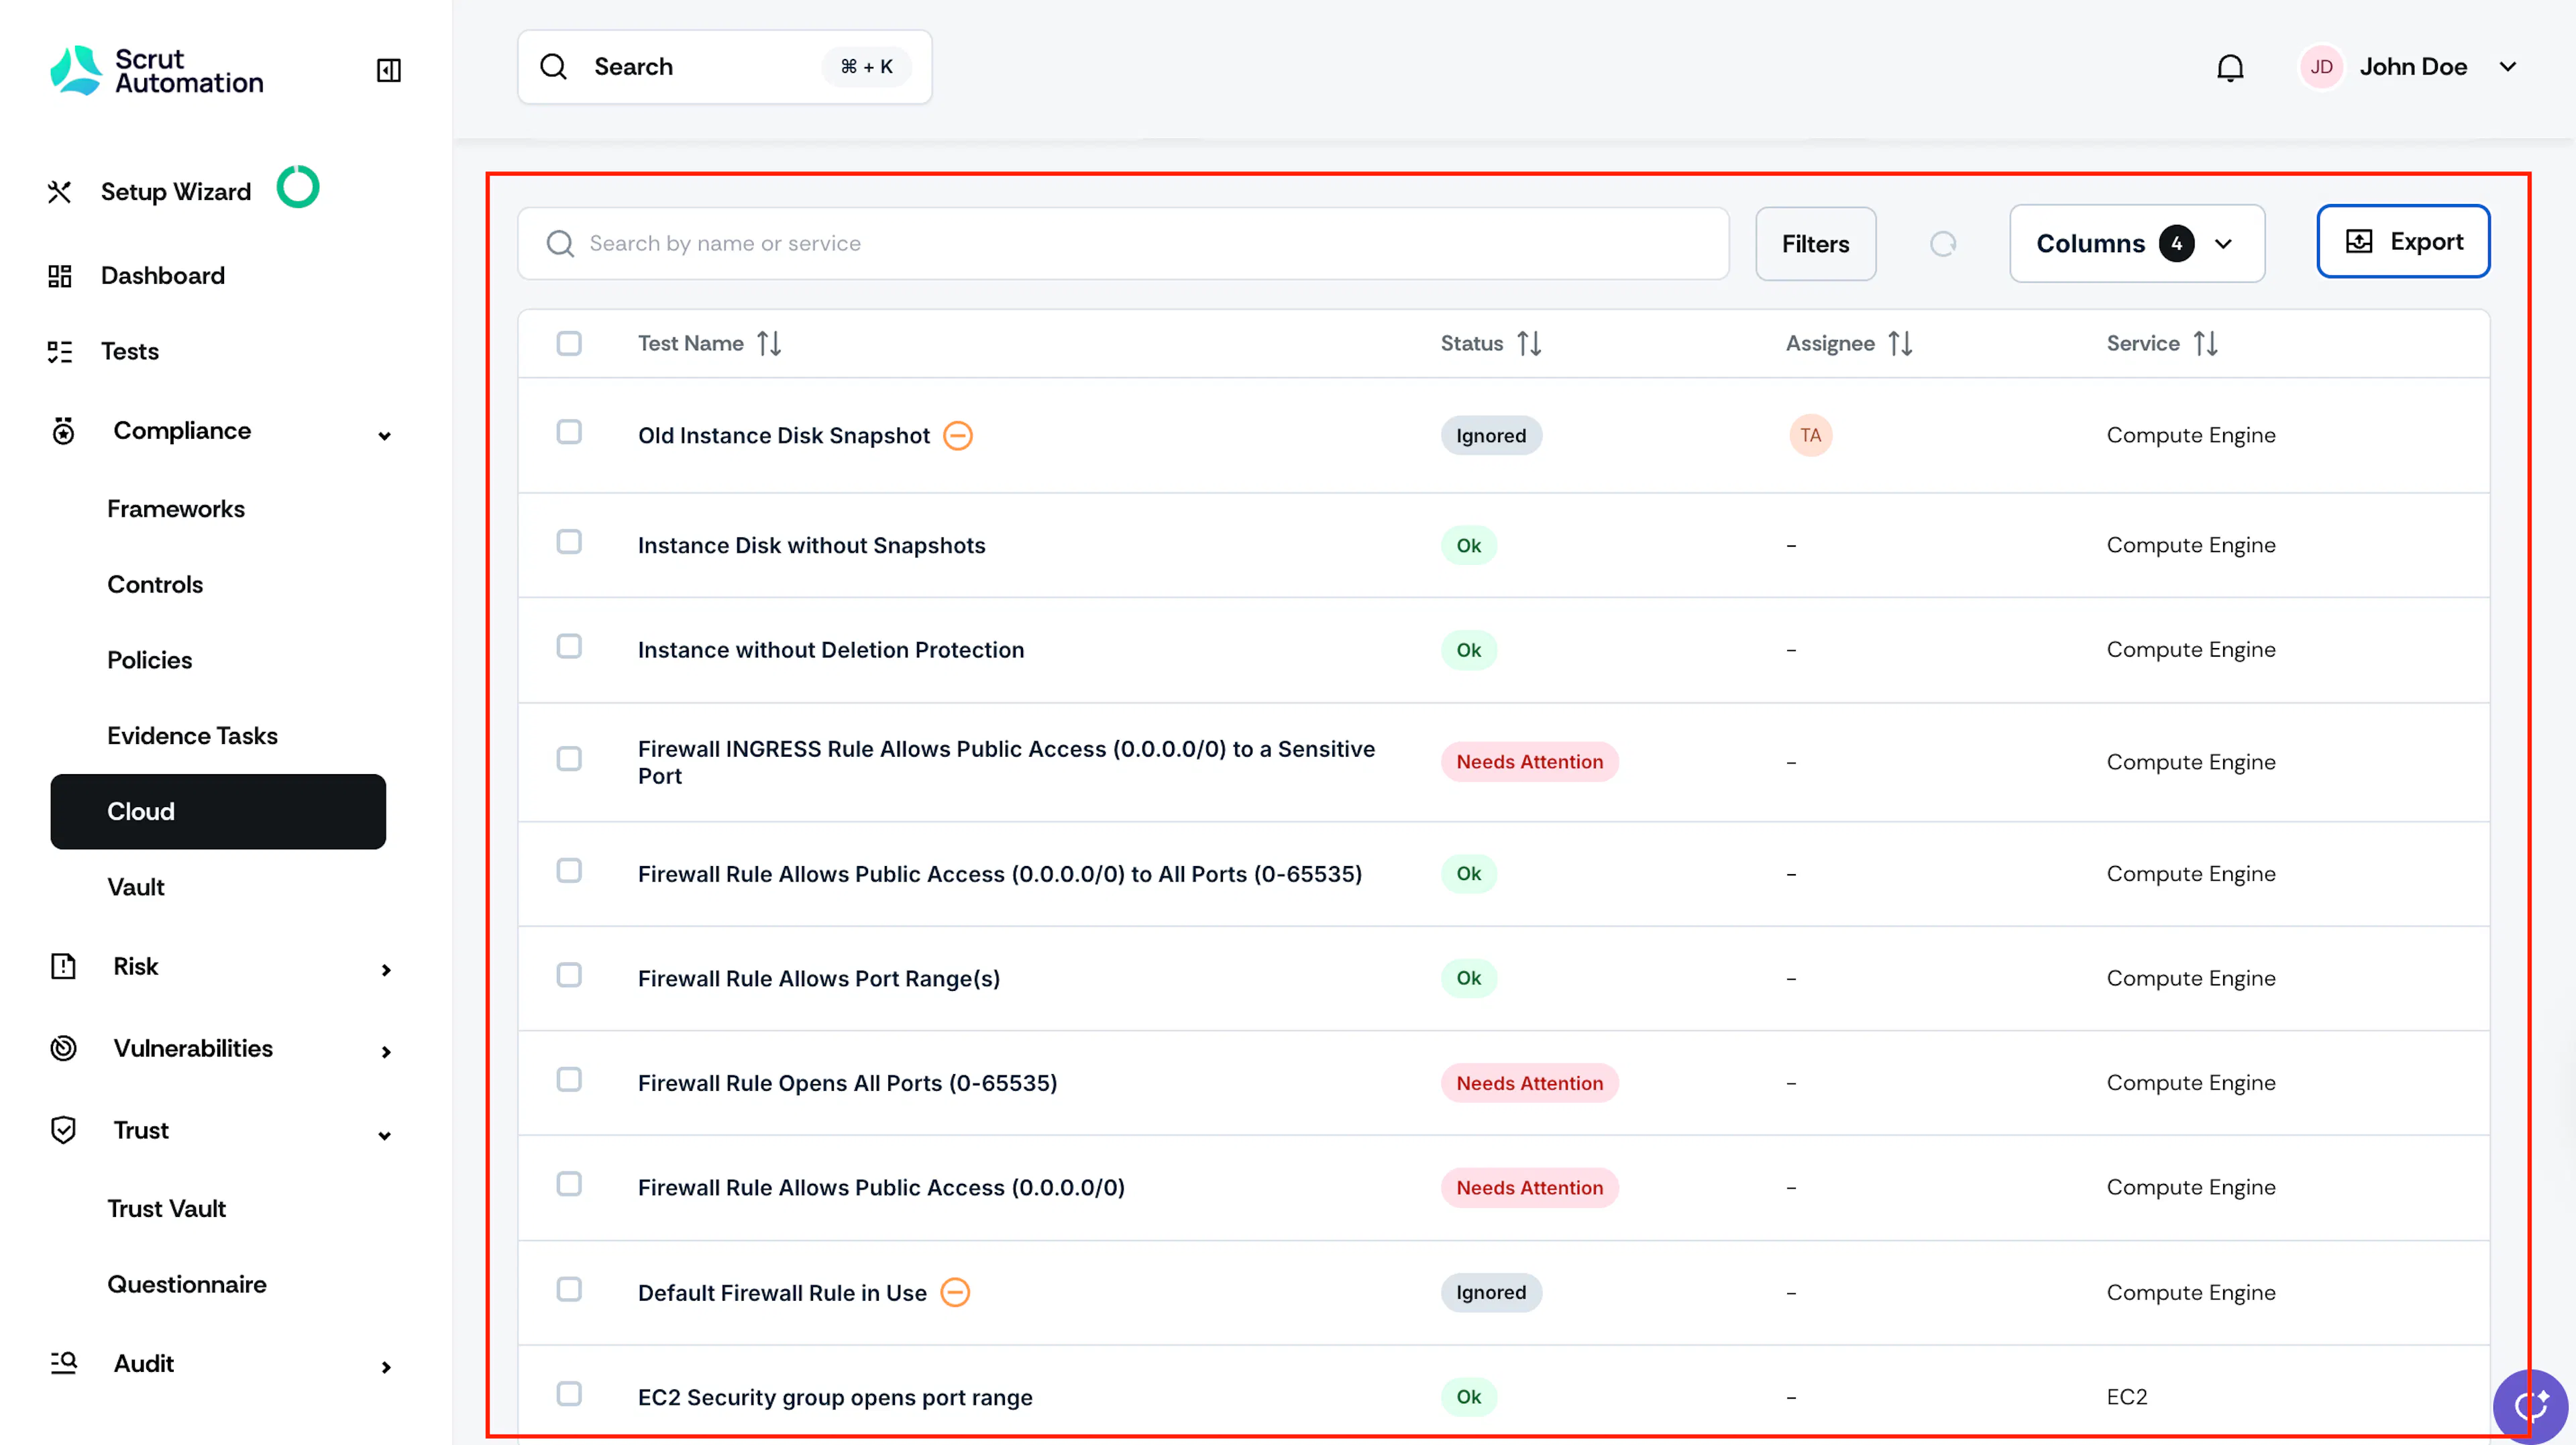
The Test table provides an overview of all the tests that Scrut has conducted on your cloud infrastructure, including relevant metadata for each test. You can use the Columns and Filters options to personalize the view and display only the data most relevant to you. You can also use the search bar at the top of the table to quickly find a specific test by name or service. Additionally, the Export button allows you to easily download the table data in CSV format, making it convenient to share with external stakeholders.
Clicking on any test on this page takes you directly to the corresponding Test Details page.
Resources Tab
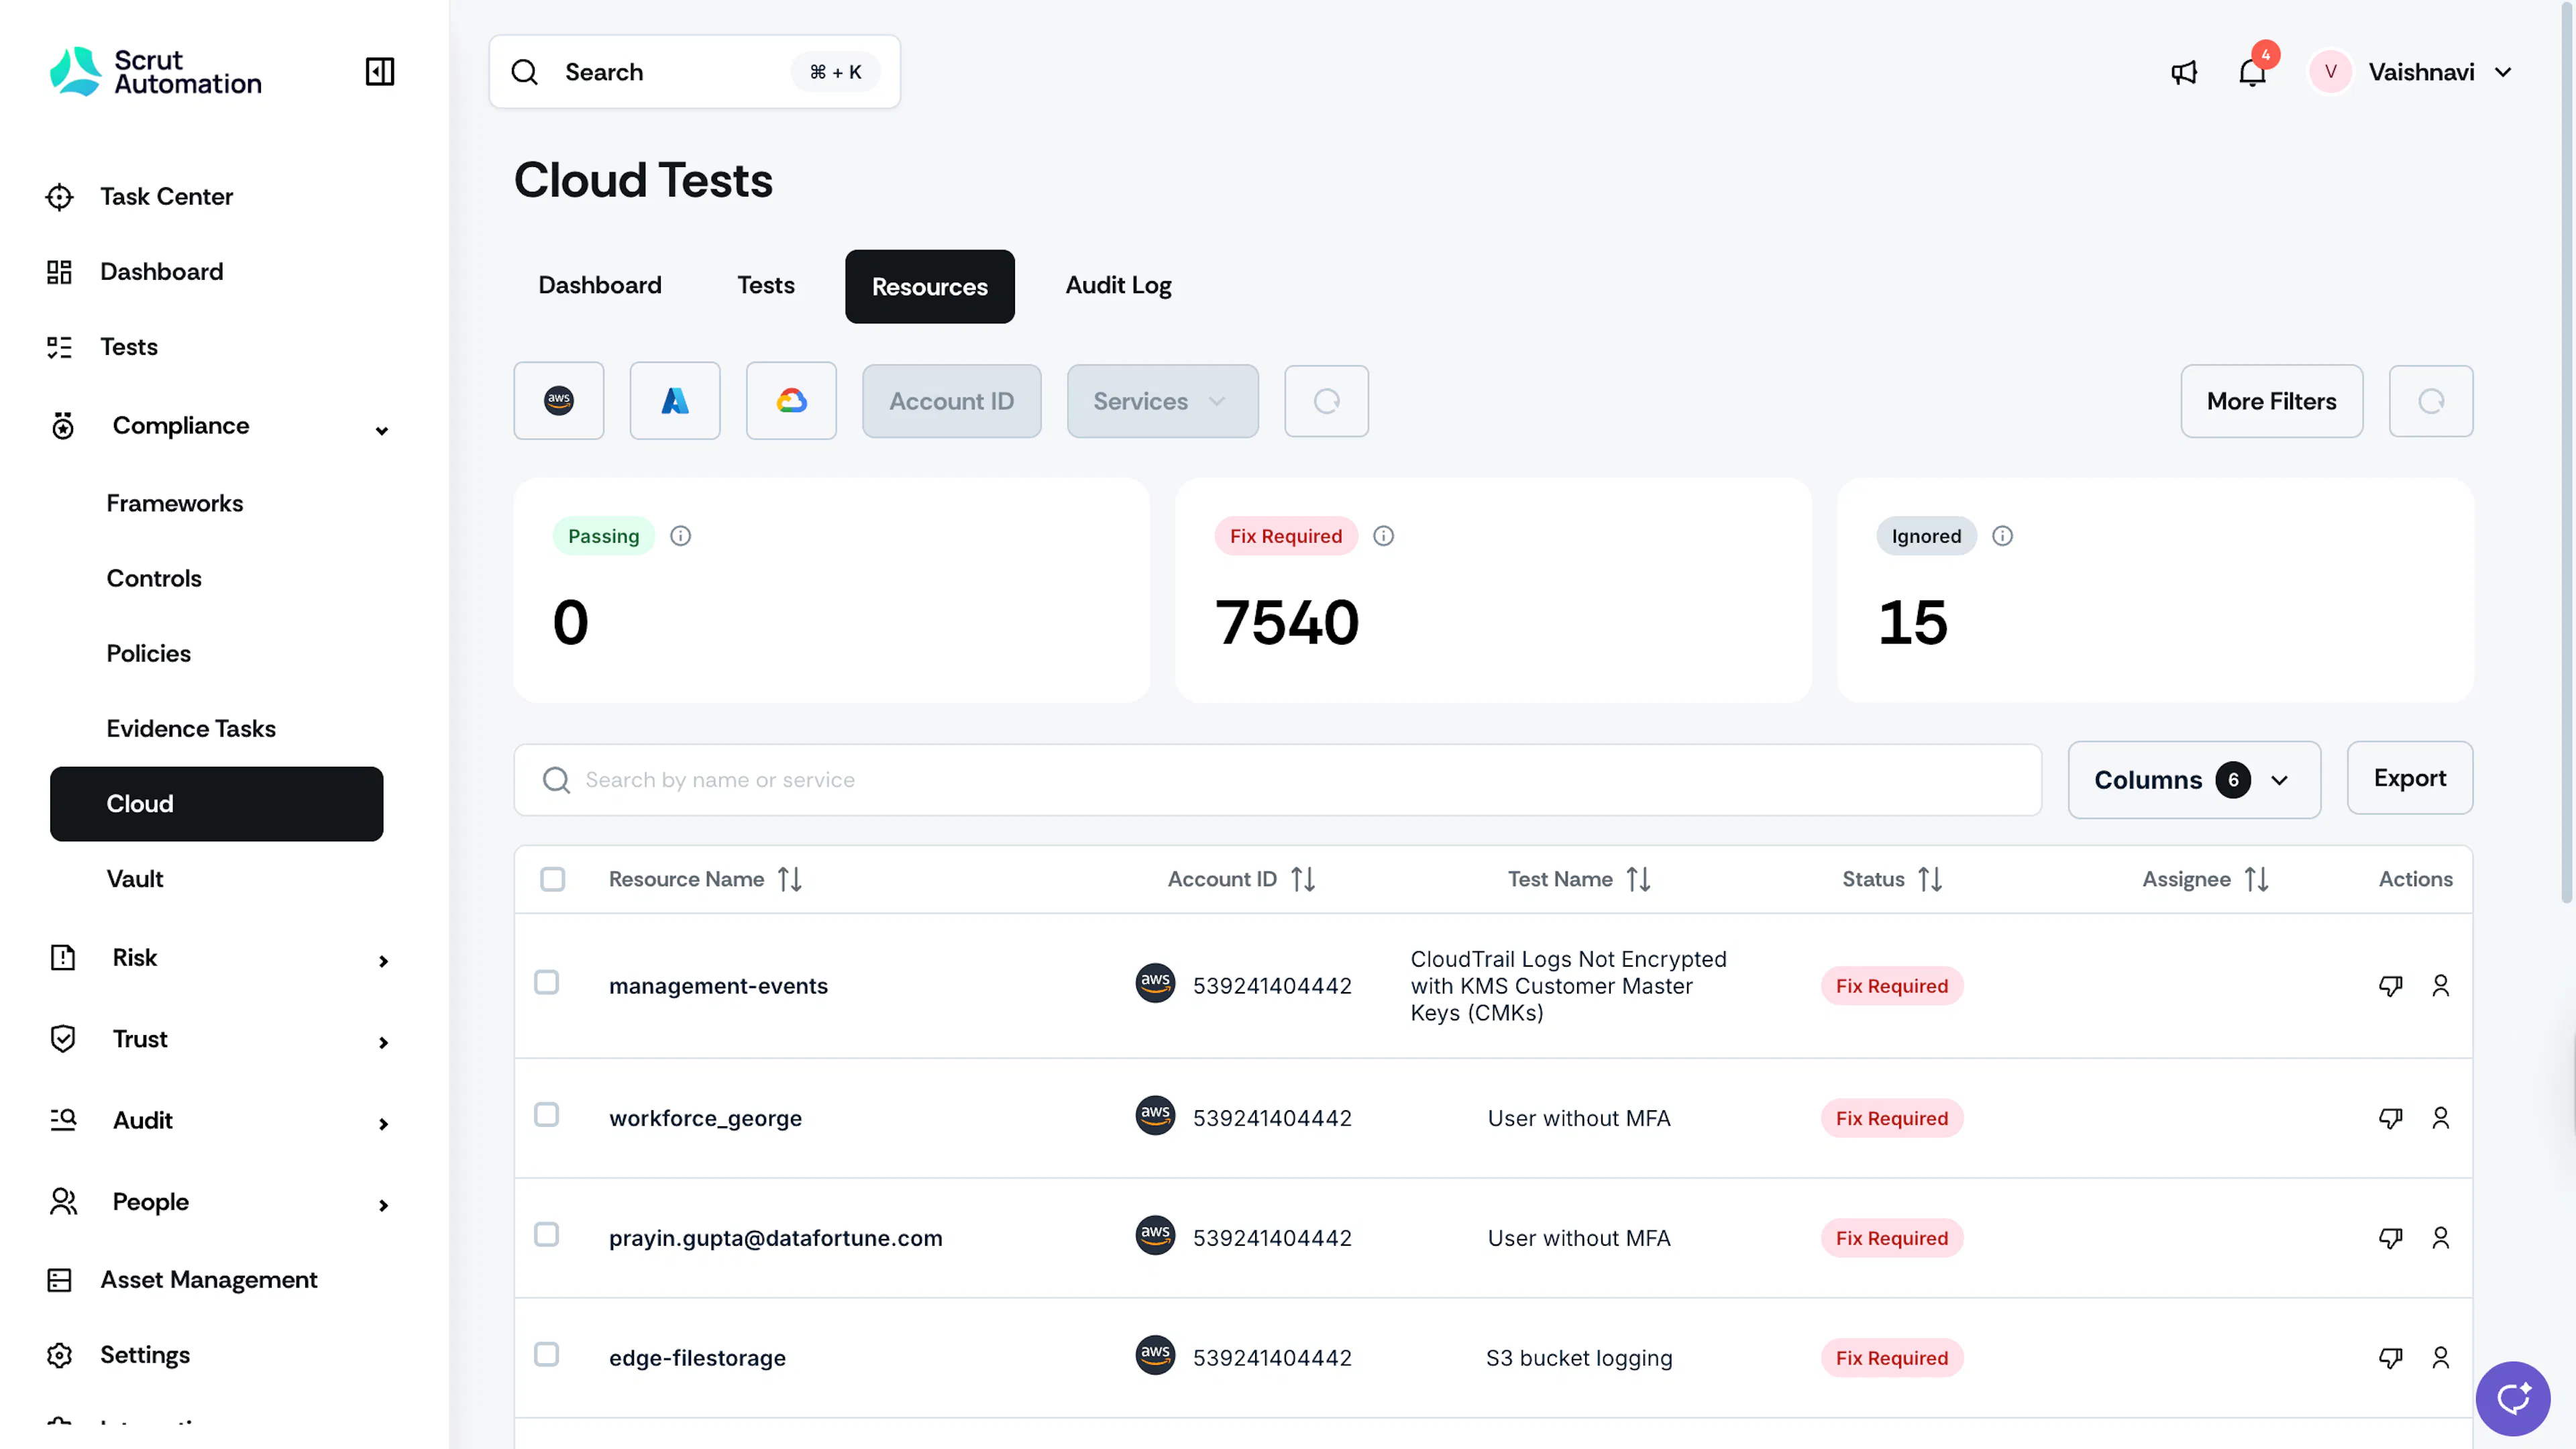
The Resources tab lists all resources that were flagged by cloud tests and resources that you have manually marked as ignored. It allows you to drill down into specific resources to understand their compliance status and associated findings.
Filters
Just like the dashboard, the Resources tab also features filters that let you drill down to view flagged resources by specific cloud providers. Additionally, use the Services filter to view resources for specific services in your cloud infrastructure. For example, if you select AWS, you can view resources for specific services such as EC2, IAM, S3, etc.
Note:
Only Services configured in the integration scope will be shown in the filter.
Resource Statuses
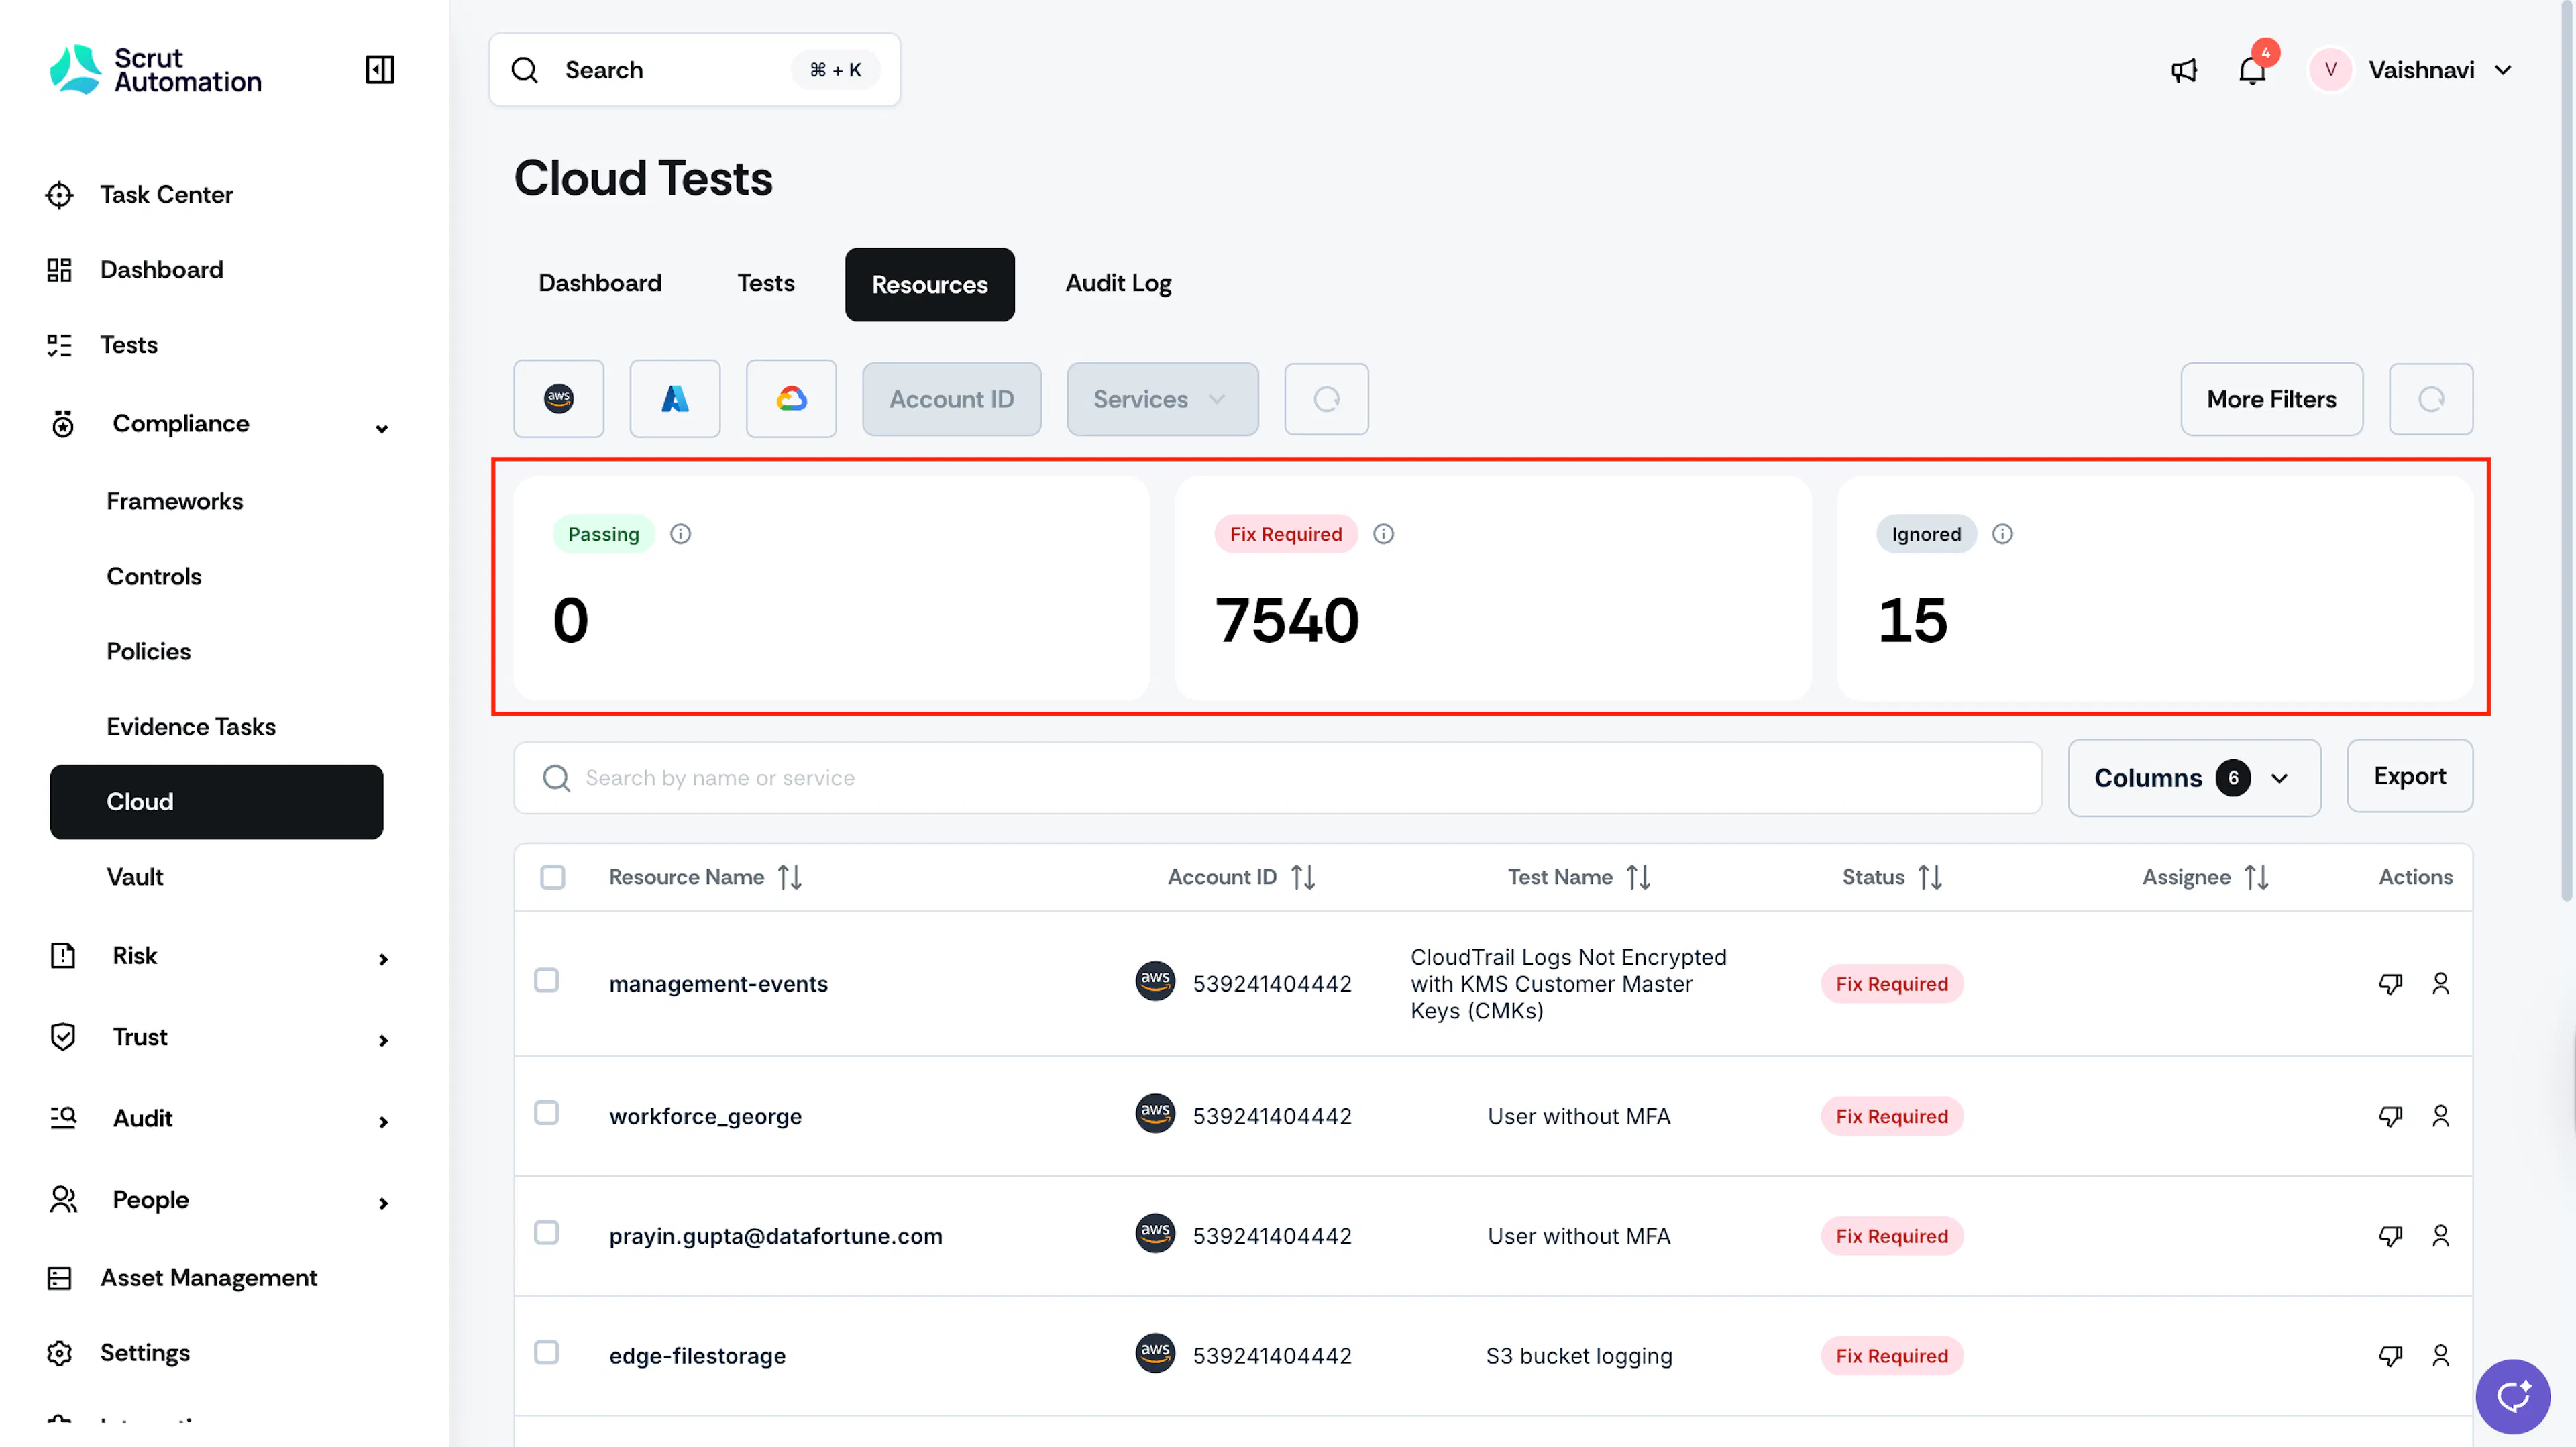
This tab categorizes resources into three statuses:
- Passing: Resources that are compliant and not flagged by any tests.
- Needs Attention: Resources flagged by one or more tests are assigned this status. A single resource can be marked as “Needs Attention” by multiple tests if it violates multiple rules. You need to remediate these resources for the associated tests to pass.
- Ignored: Scrut assigns this status to resources that you have manually marked as “Ignored.” Ignored resources are no longer considered in the compliance status, meaning they will not affect overall compliance metrics or outcomes.
Resources Table
The Resources table provides an overview of all the resources flagged by cloud tests. Use the Columns and Filters options to personalize the view and display only the data most relevant to you. You can also use the search bar at the top of the table to quickly find a specific resource by name or service. Additionally, the Export button allows you to easily download the table data in CSV format, making it convenient to share with external stakeholders.
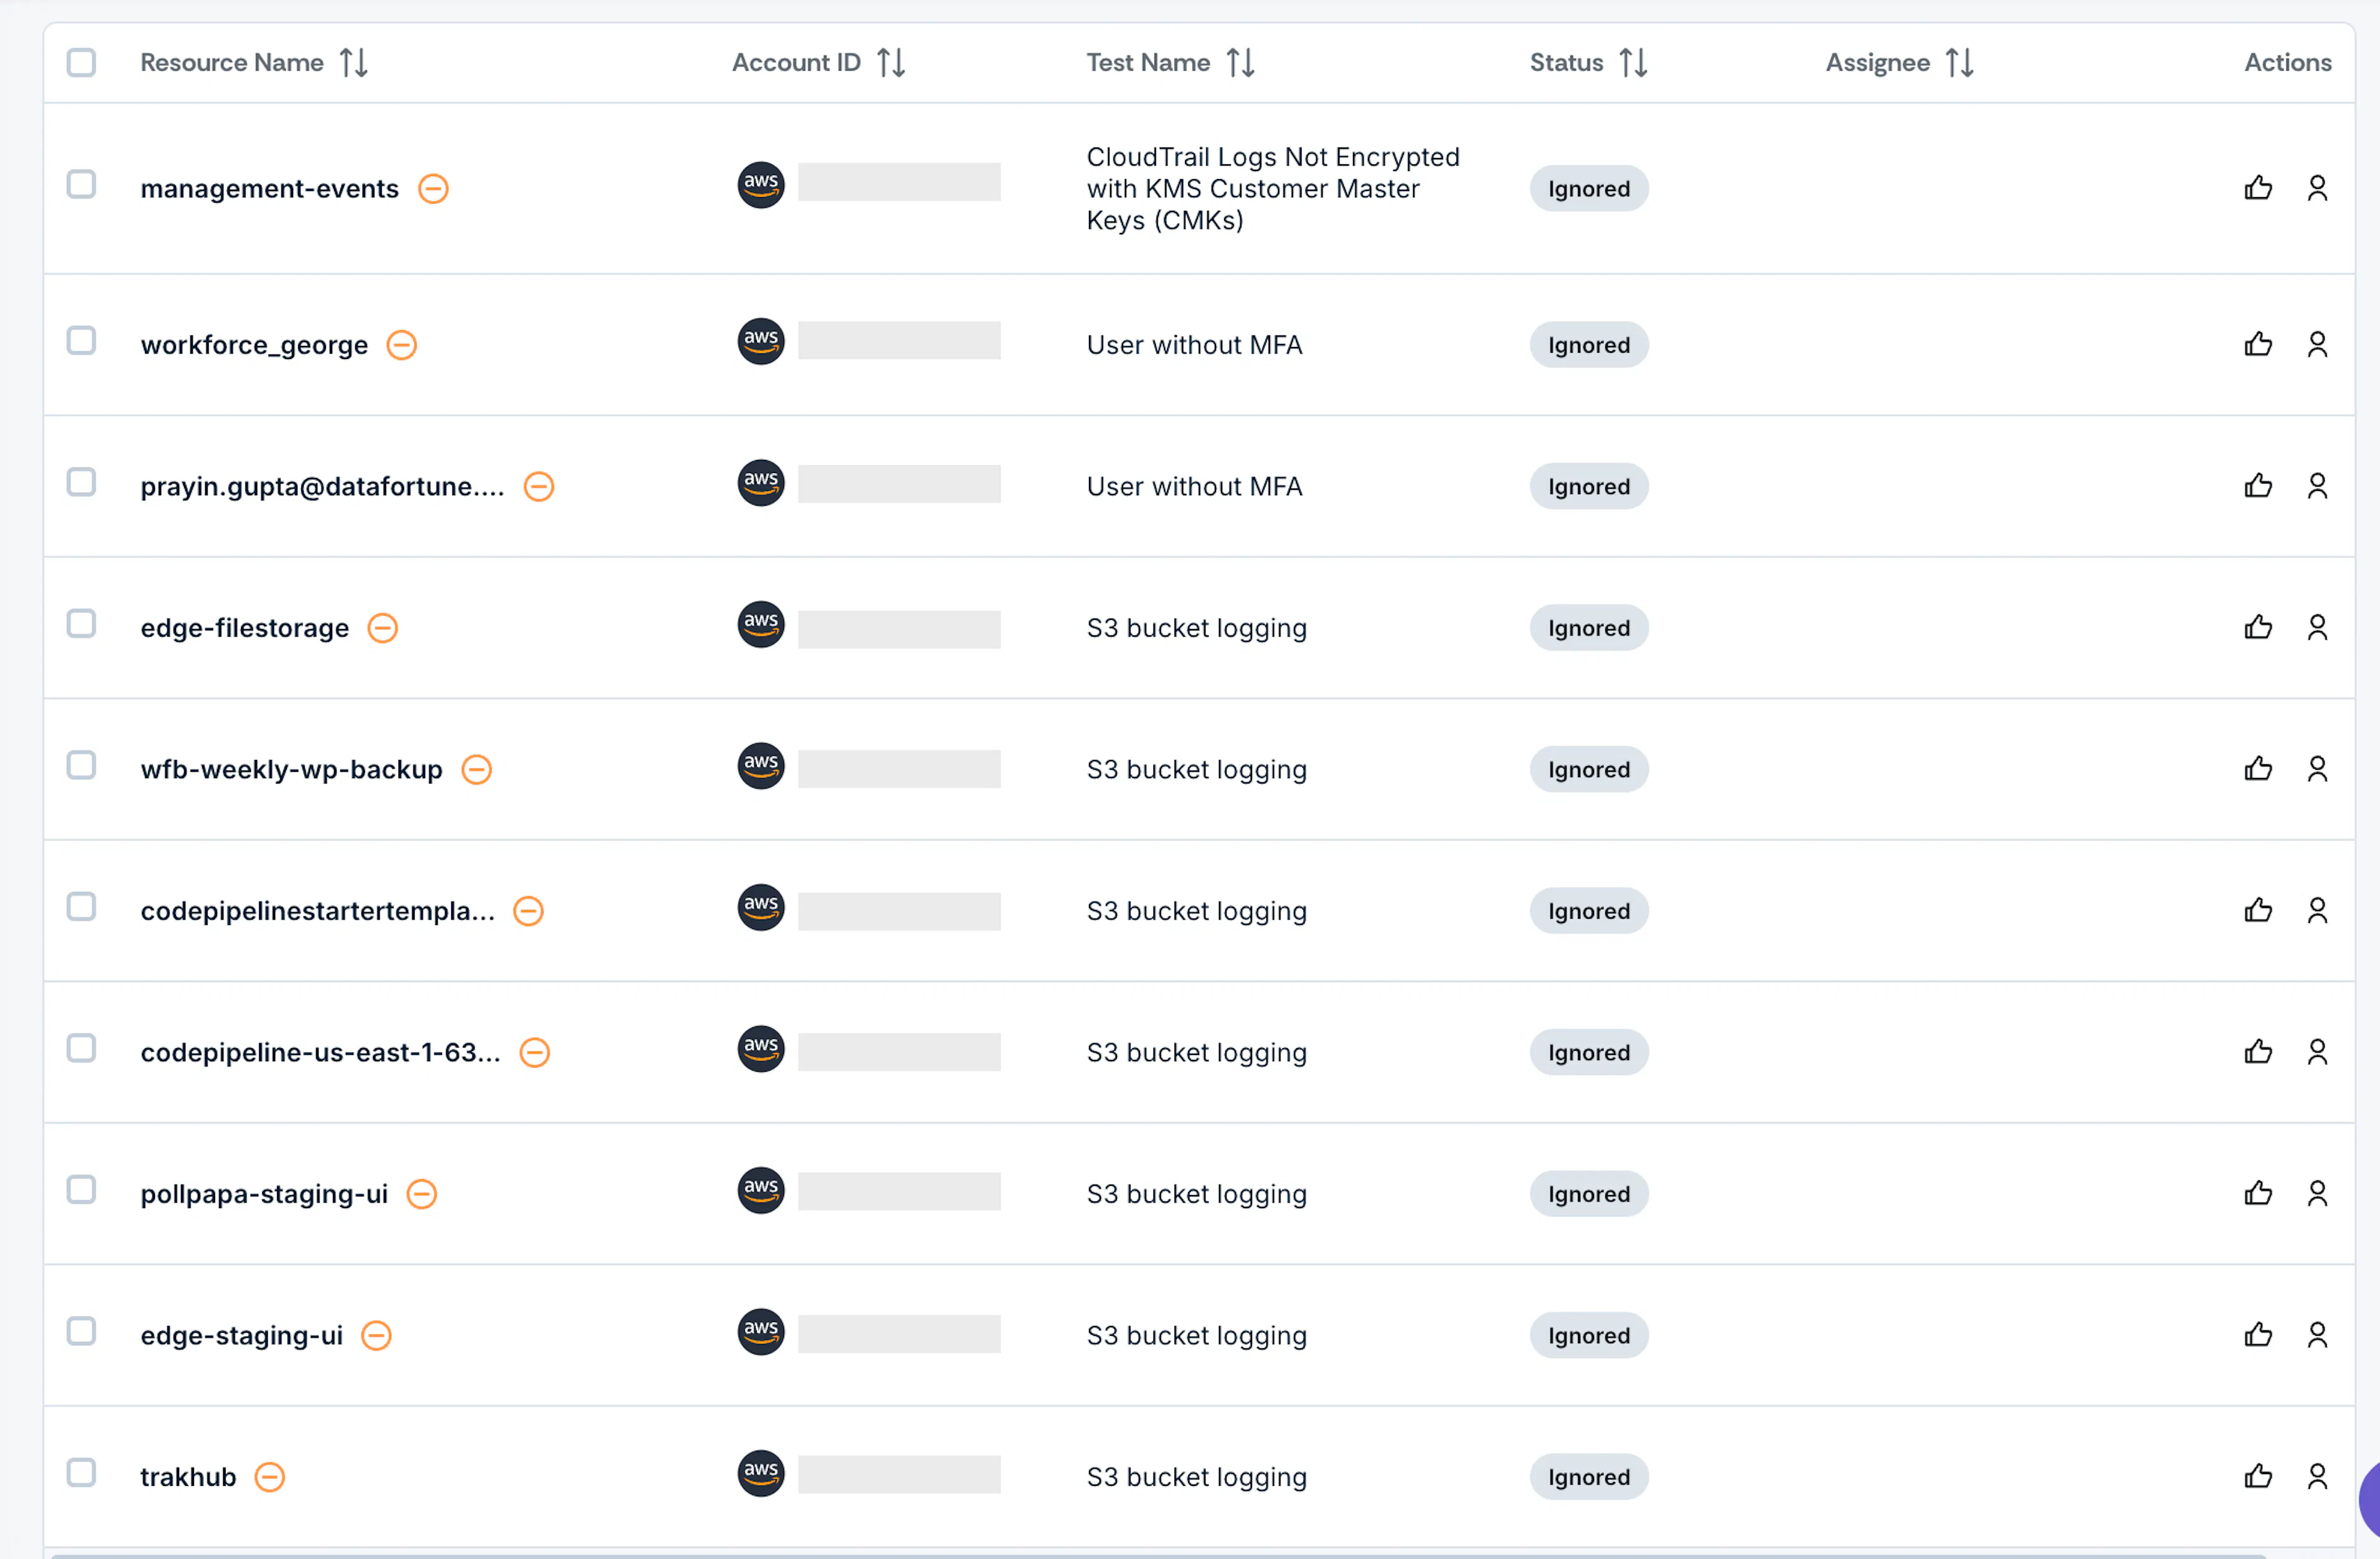
Clicking on any resource in this table takes you to the corresponding test that flagged this resource.
Audit Log Tab
The Audit Logs track all user activities, changes, and scan activities in the cloud module.
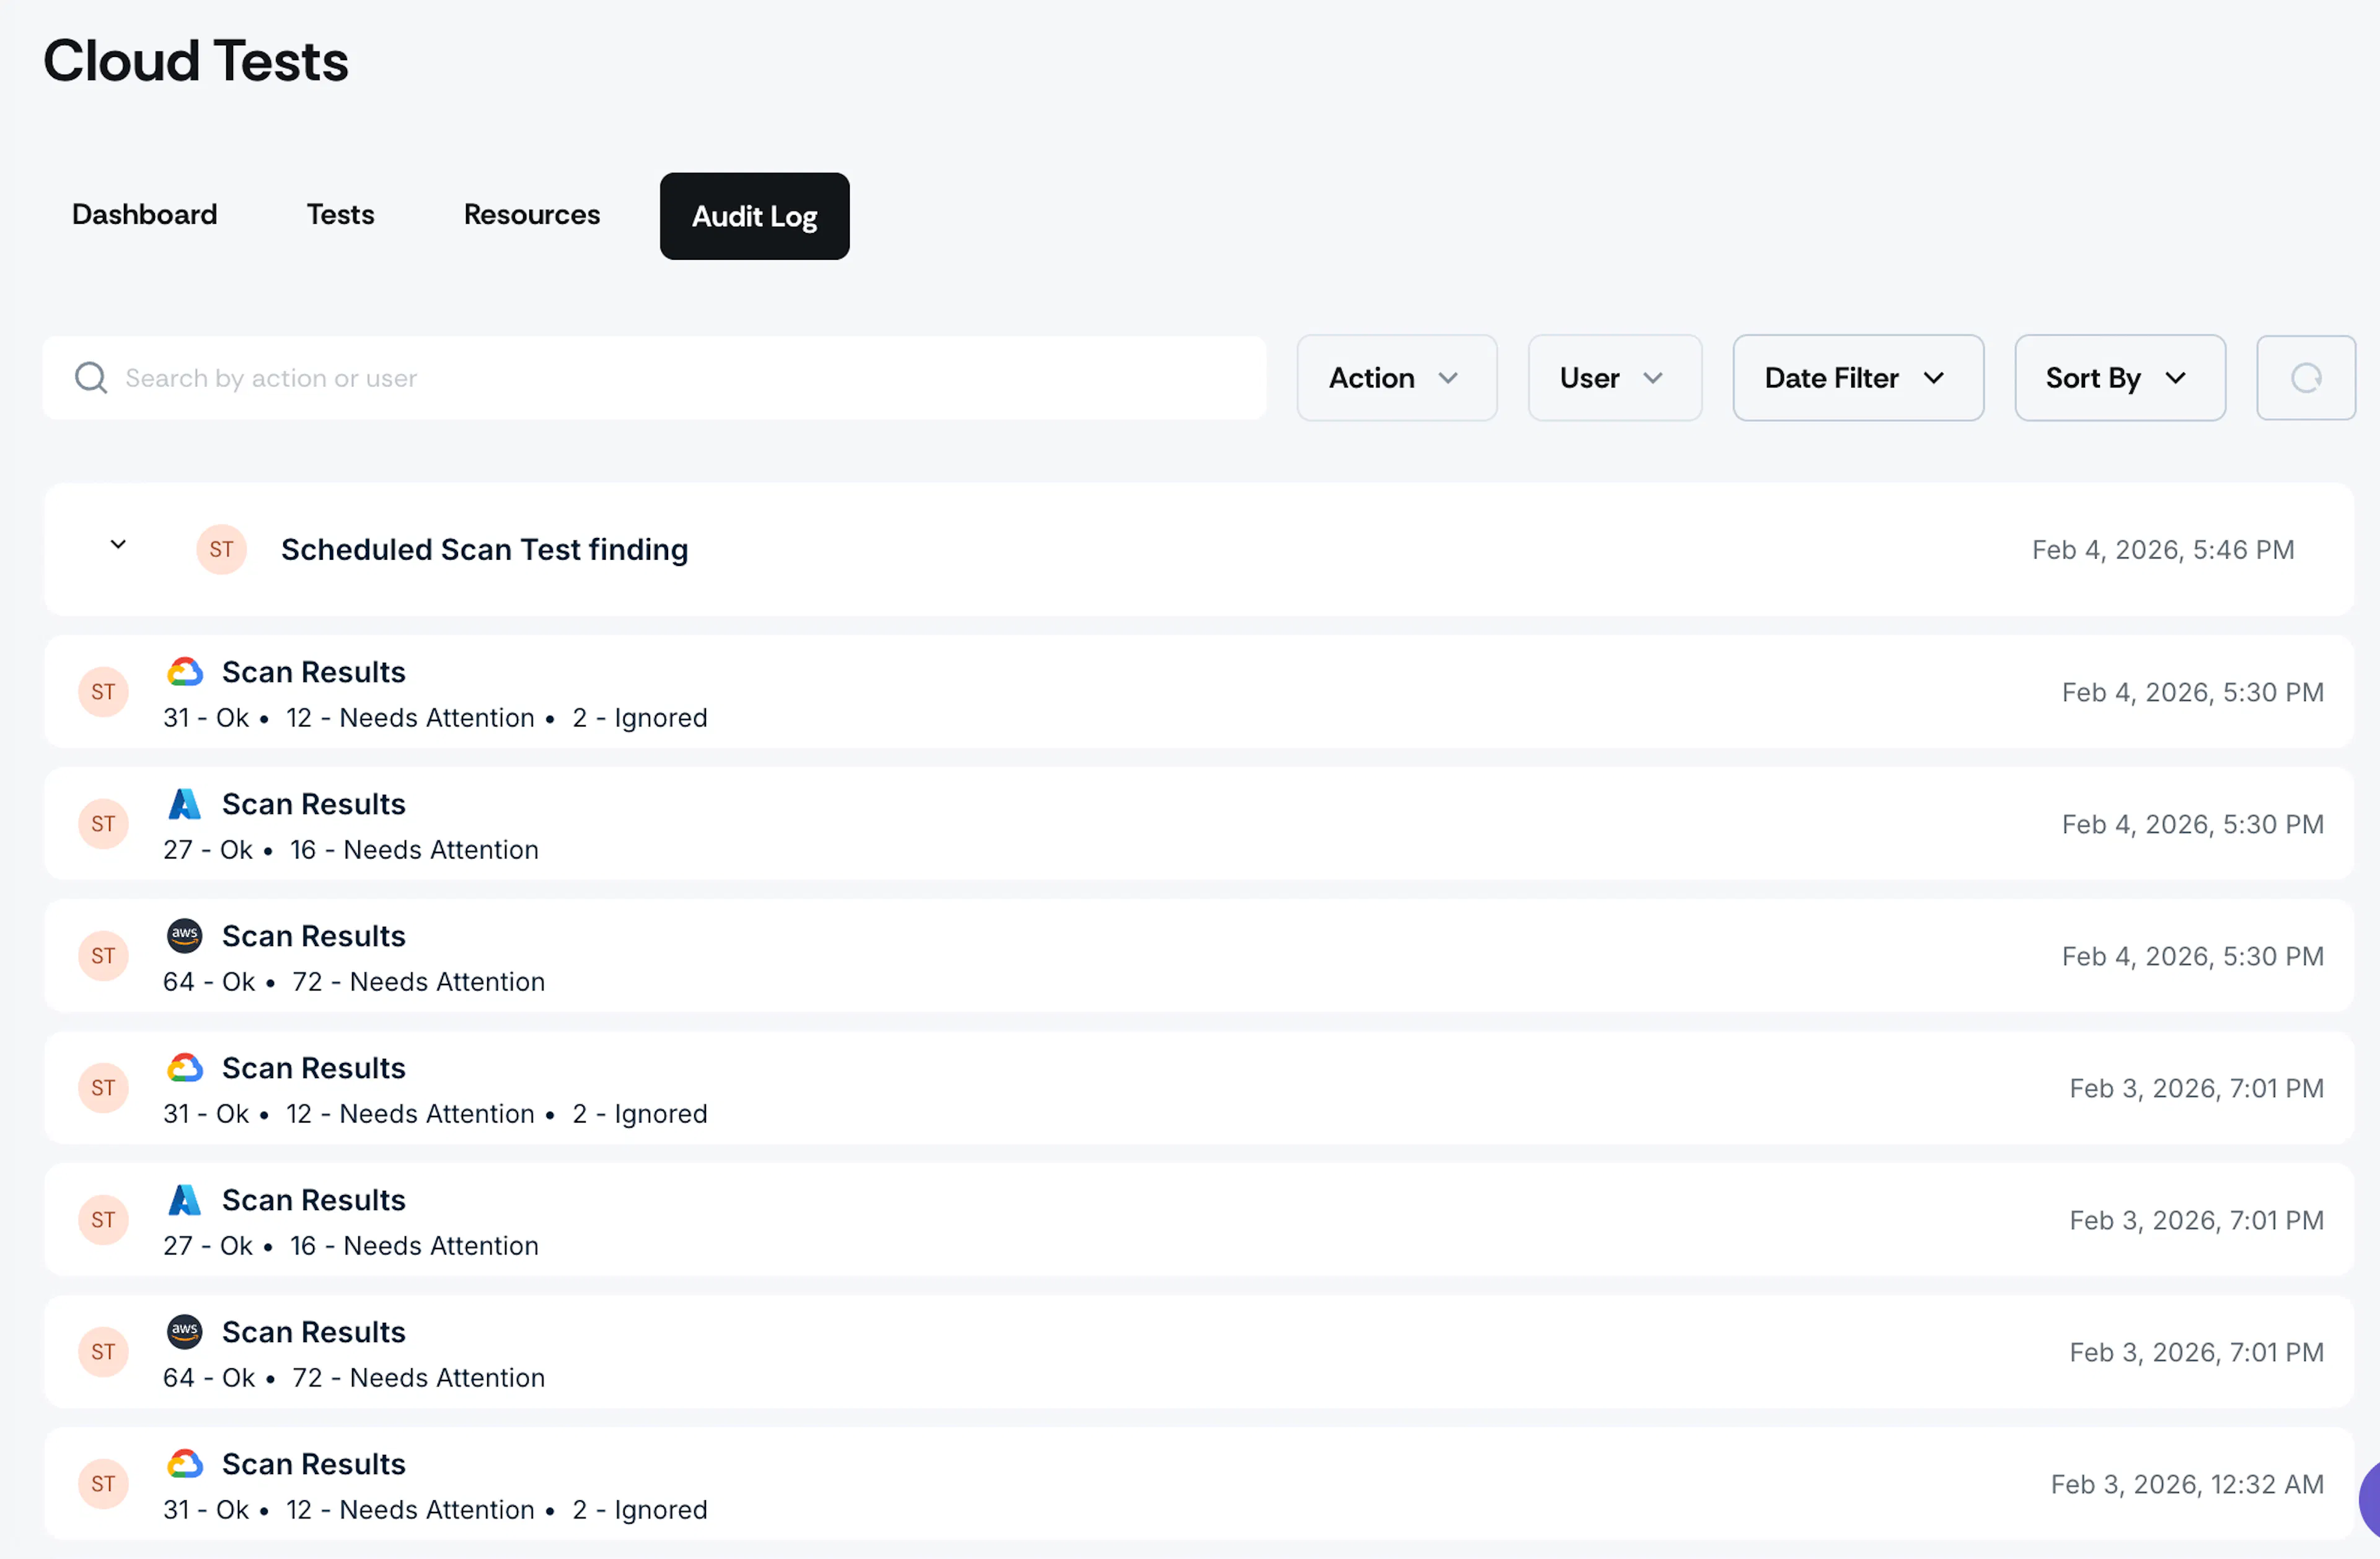
Filters
Use the filters at the top of the Audit Log tab to view specific log entries.
-
Action: This filter refines entries by actions such as:
- Test Assigned: Shows who assigned which test to team members, with assignment details
- Test Monitored: Tracks when a test was added to the monitoring status
- Test Ignored: Records when a test was ignored, along with the reason and the user who ignored it
- Resource Assigned: Shows who assigned specific flagged resources to team members for remediation
- Resource Ignored: Records when individual resources within a test were ignored
- Resource Monitored: Tracks when specific resources were added to the monitoring status
- Test Now Clicked: Records manual scan triggers initiated by users via the "Test Now" button
- Tests Exported: Logs when test data was exported from the platform
- Resources Exported: Logs when resource data was exported from the platform
- PM Task Created: Records when project management tasks were created and linked to tests
- Scan Results: Displays automated scan job results showing overall test statuses on a specific day
- Scheduled Scan Test Result: Displays results from daily automated scans, showing which tests changed status
- On-Demand Scan Result: Displays results from manually triggered scans, showing which tests changed status
- Risk Created: Records when risks were created and linked to tests or resources
-
User: This filter narrows log results by specific users.
-
Date: View log entries for a specific period.
-
Sort By: Sort entries based on newest or oldest first.
Interpreting Scan Results: Each audit log entry shows:
- Date and time of the scan
- Number of tests in each status (Okay, Needs Attention, Ignored)
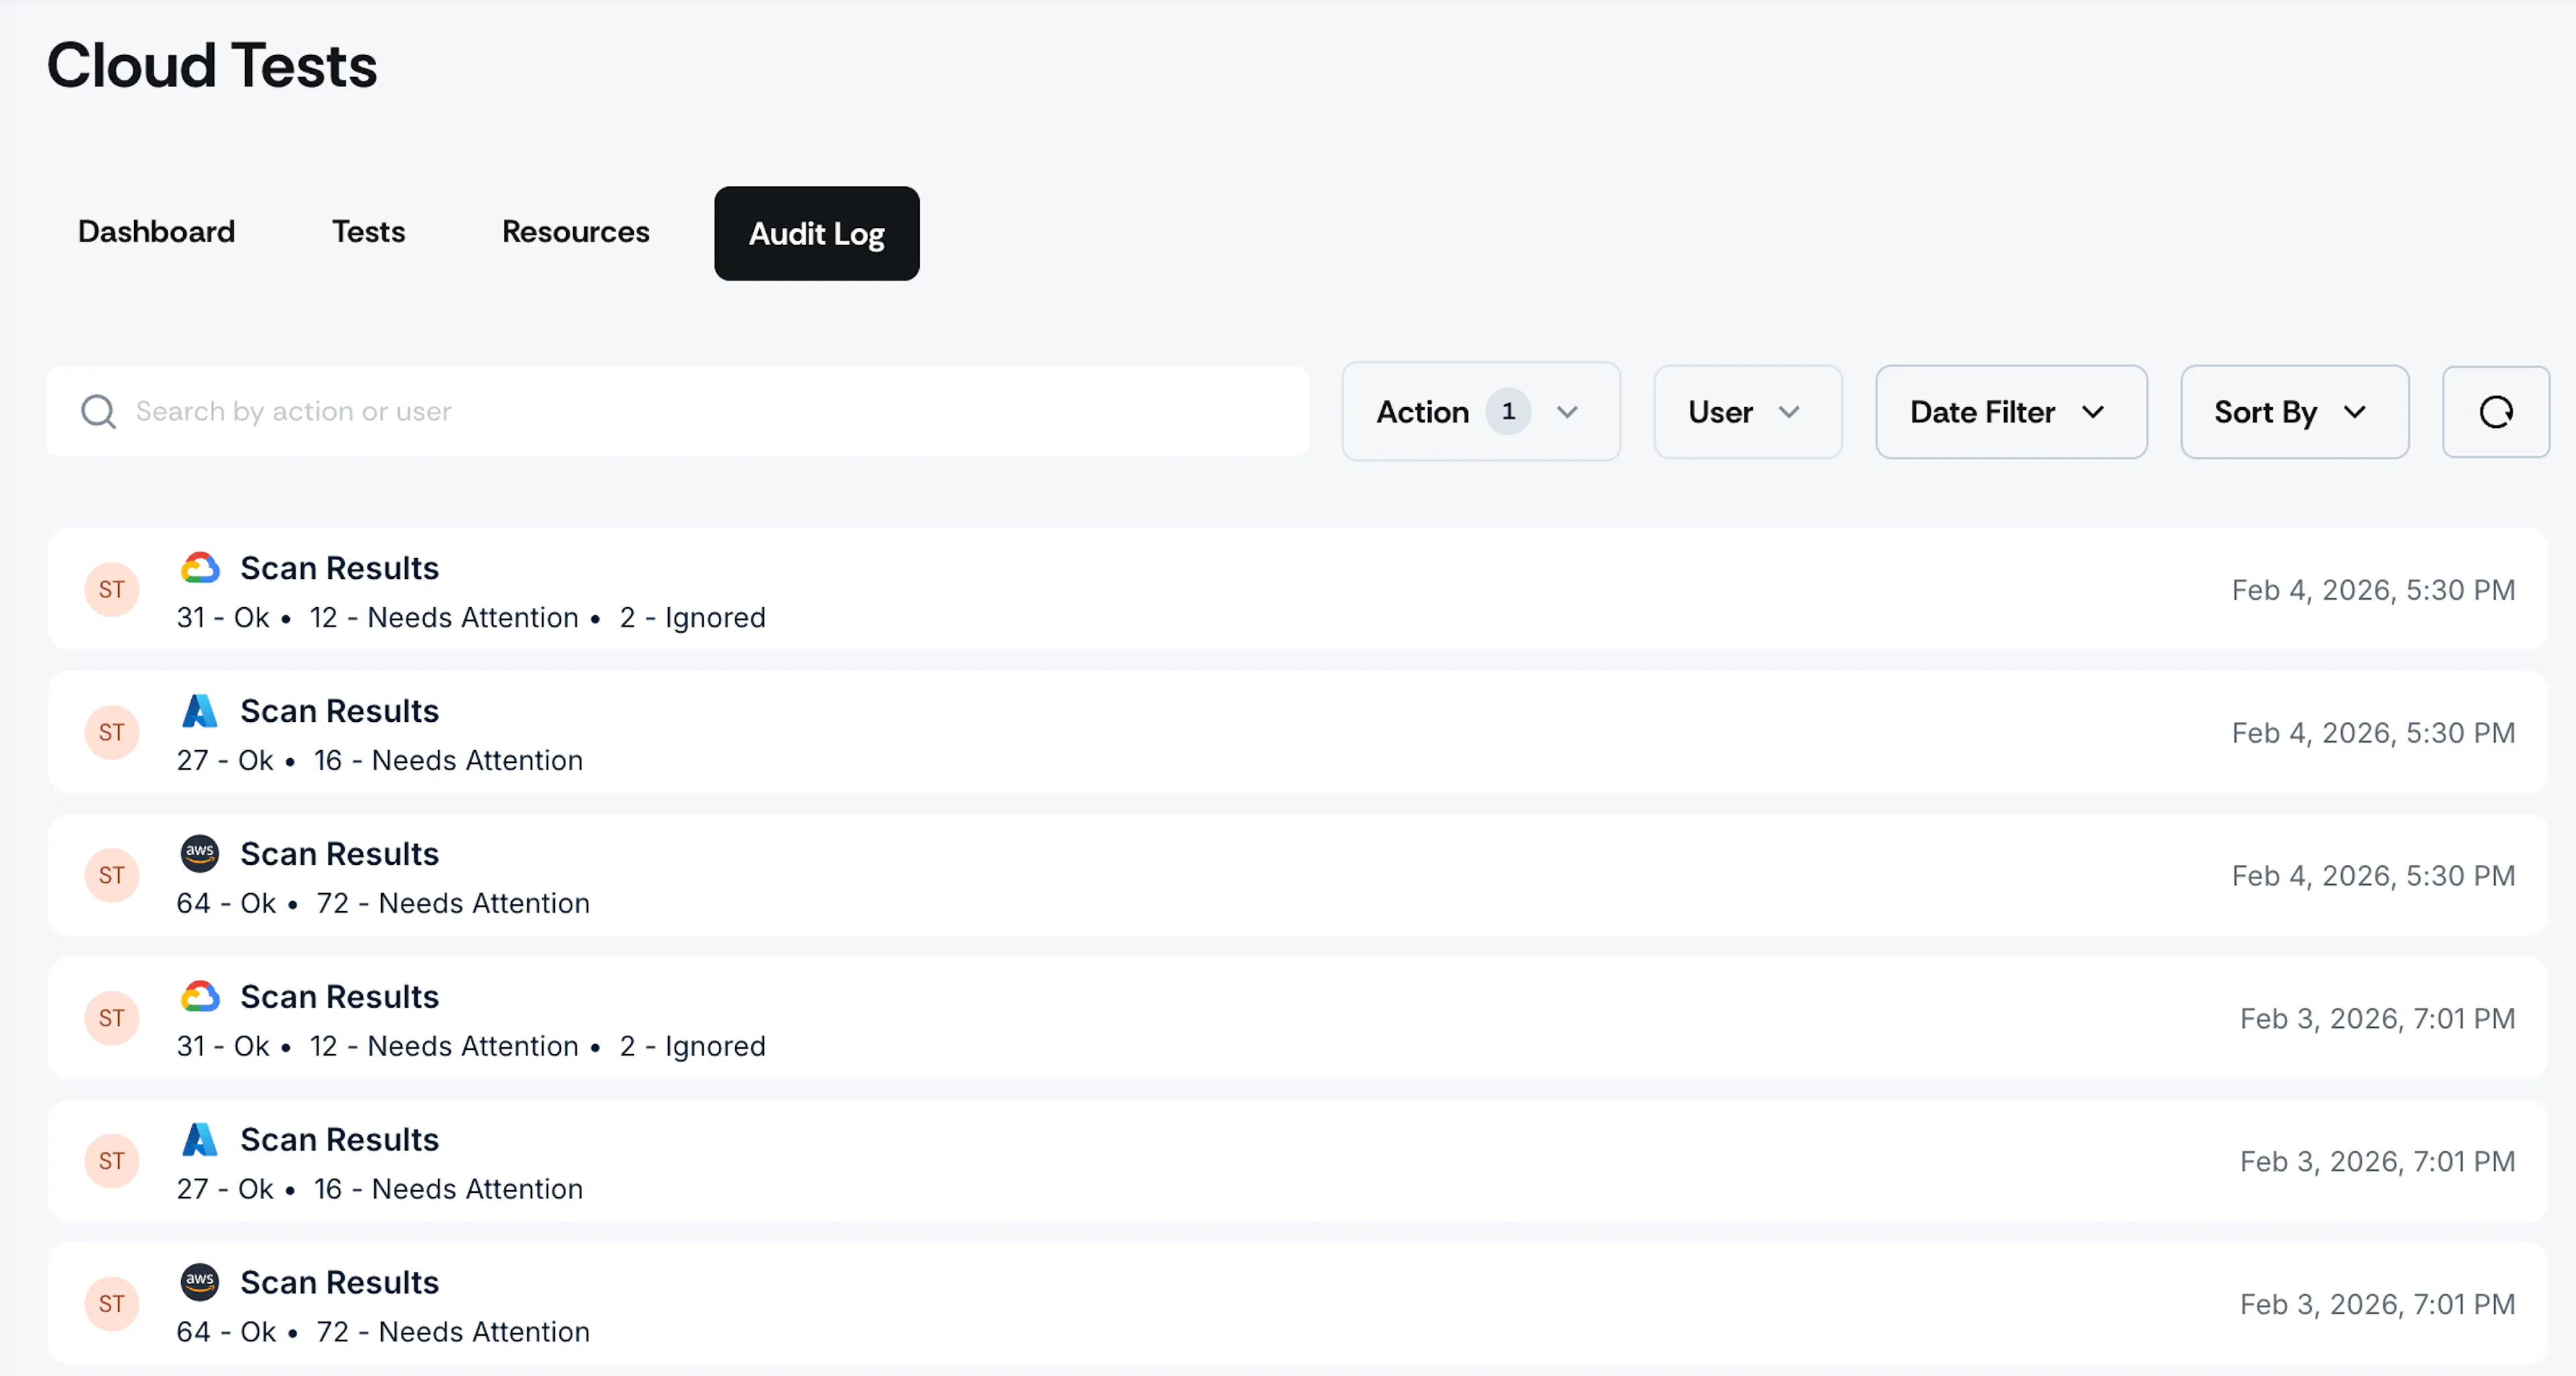
This helps you compare how scan results vary from day to day.