

Step 3: Review Scan Results
Once the scan is complete, you can review the results from the following sections:
1: Dashboard
What you’ll see: A comprehensive overview of all scan findings, providing an at-a-glance summary of your security posture.
Navigate to Vulnerabilities → Findings to view the Findings dashboard. Use it to observe key trends and patterns in your security landscape. Review the current state of all findings through interactive visualizations, including Scan Frequency, Scan Findings, and Total Resources Affected Over Time.
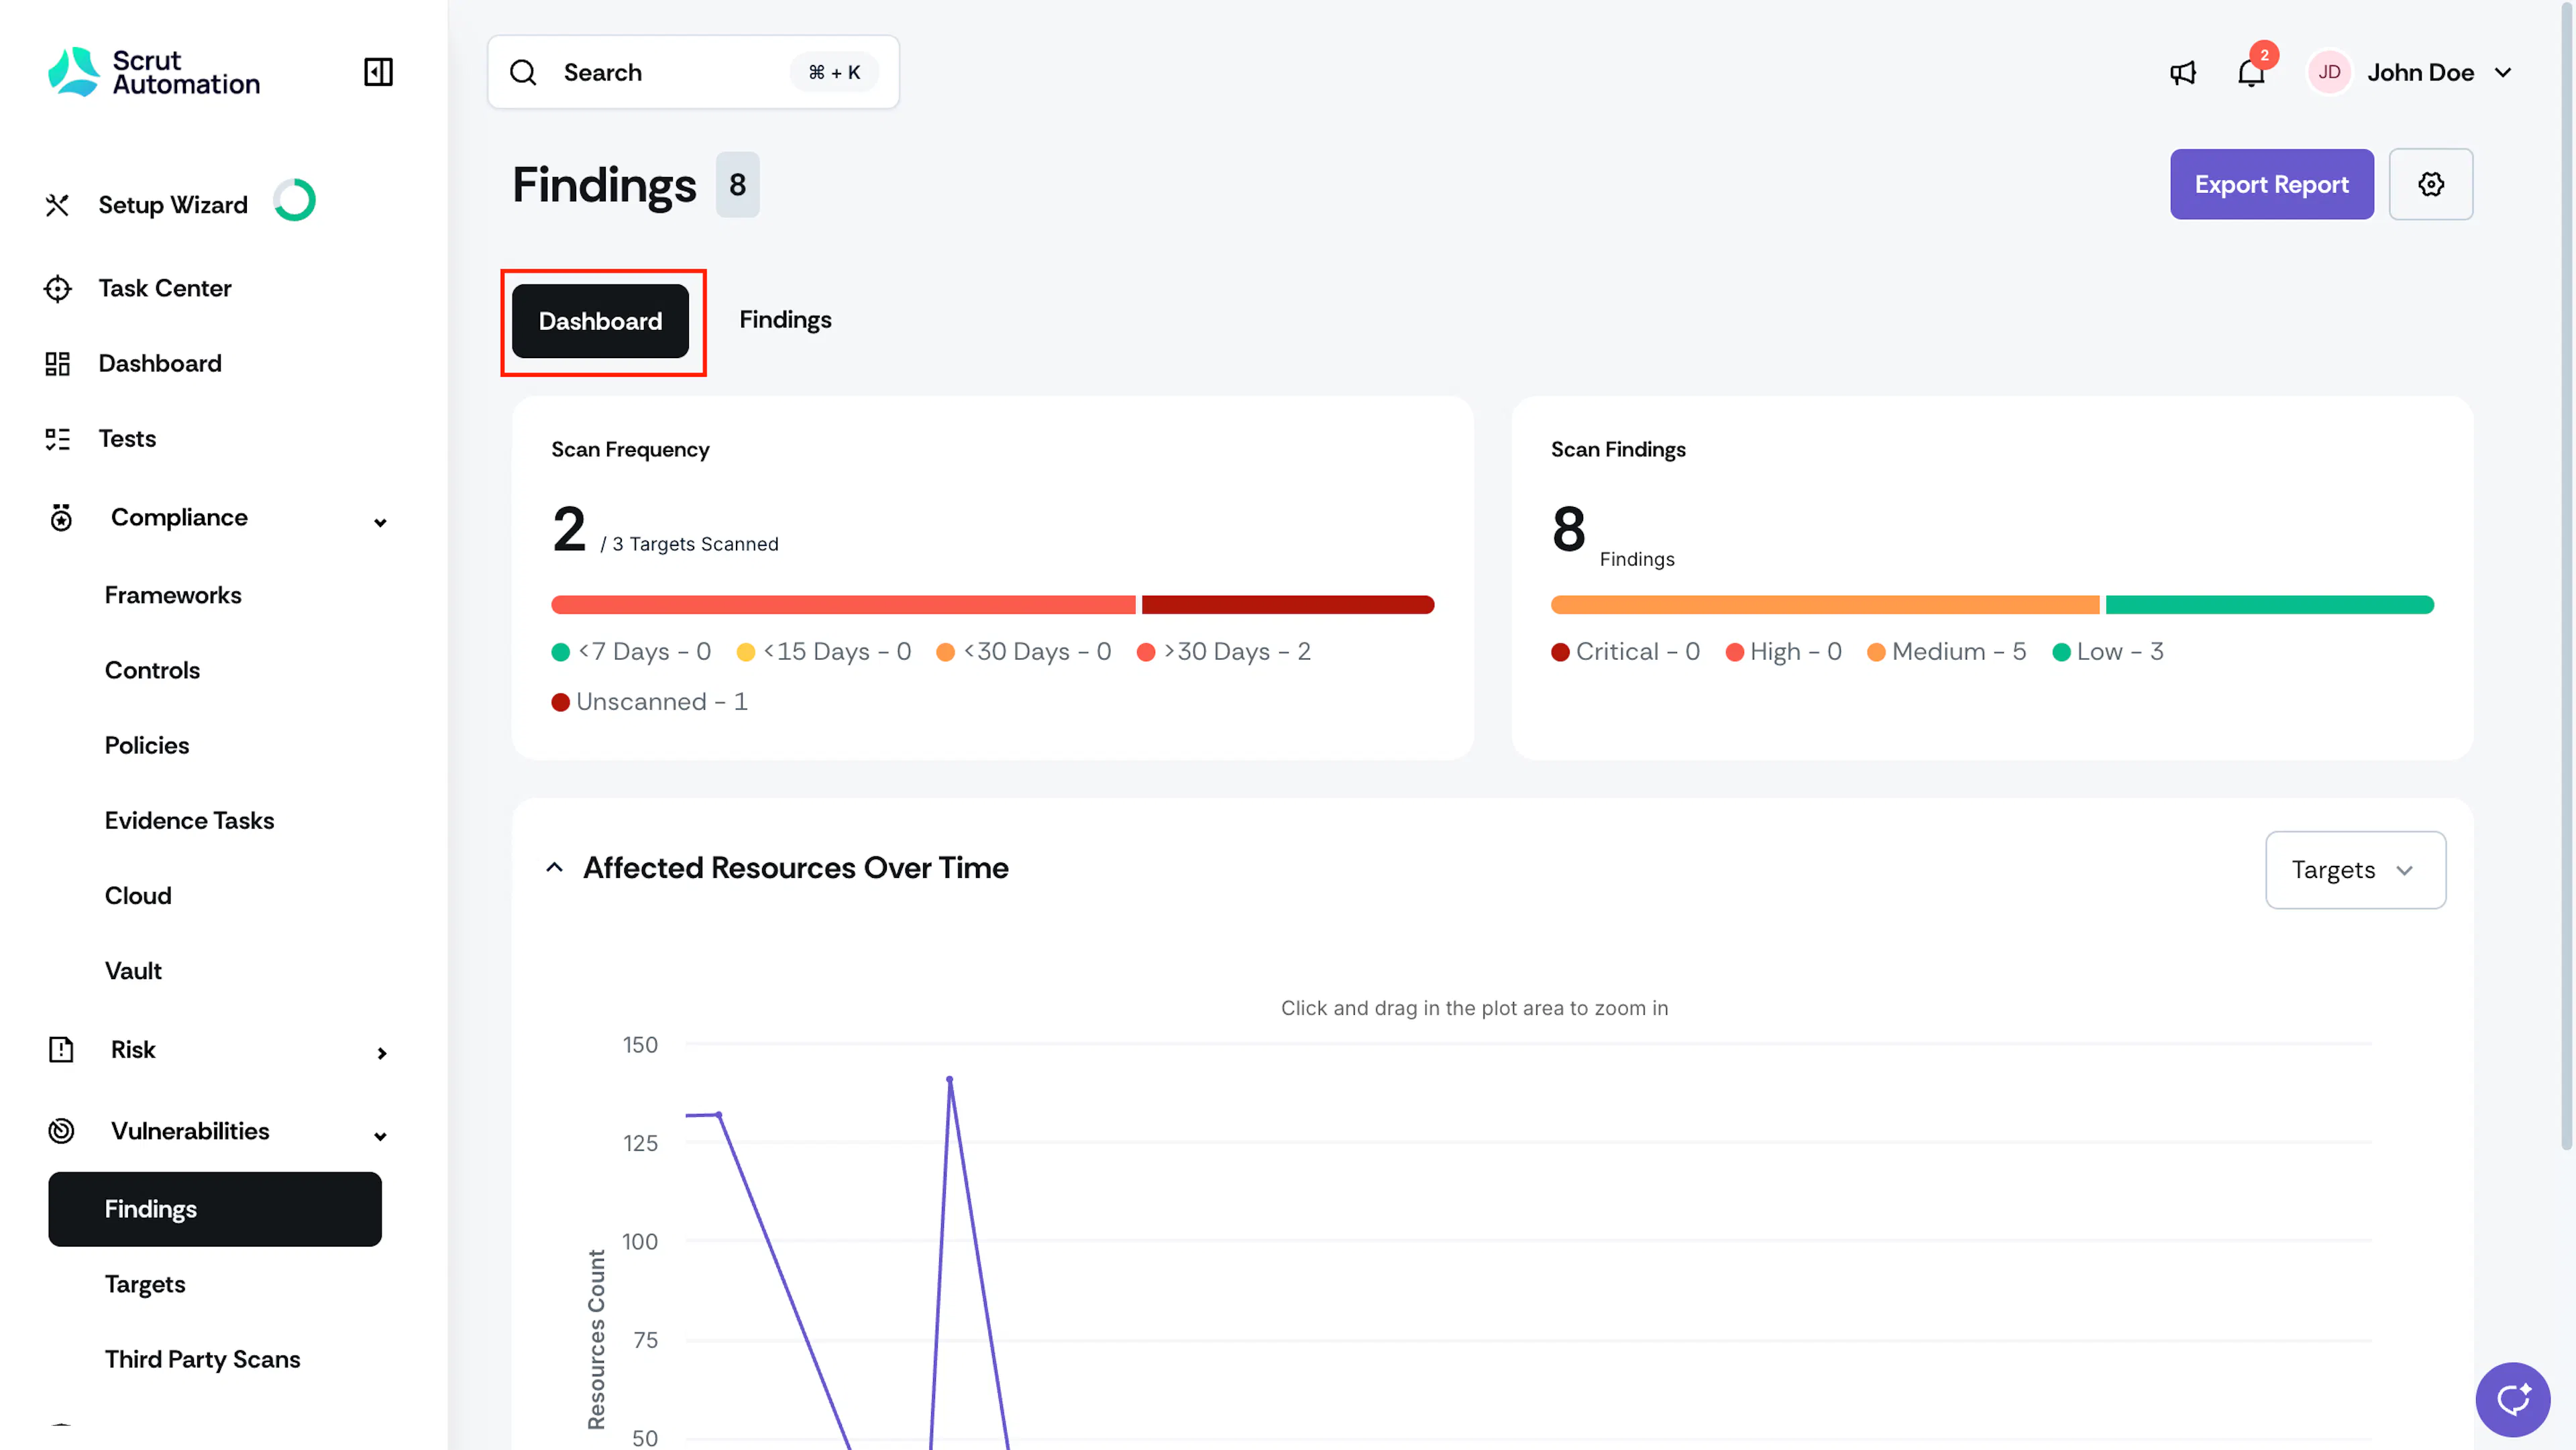
The Scan Frequency chart shows the number of scanned targets and scans triggered over the last 30 days, along with a detailed breakdown.
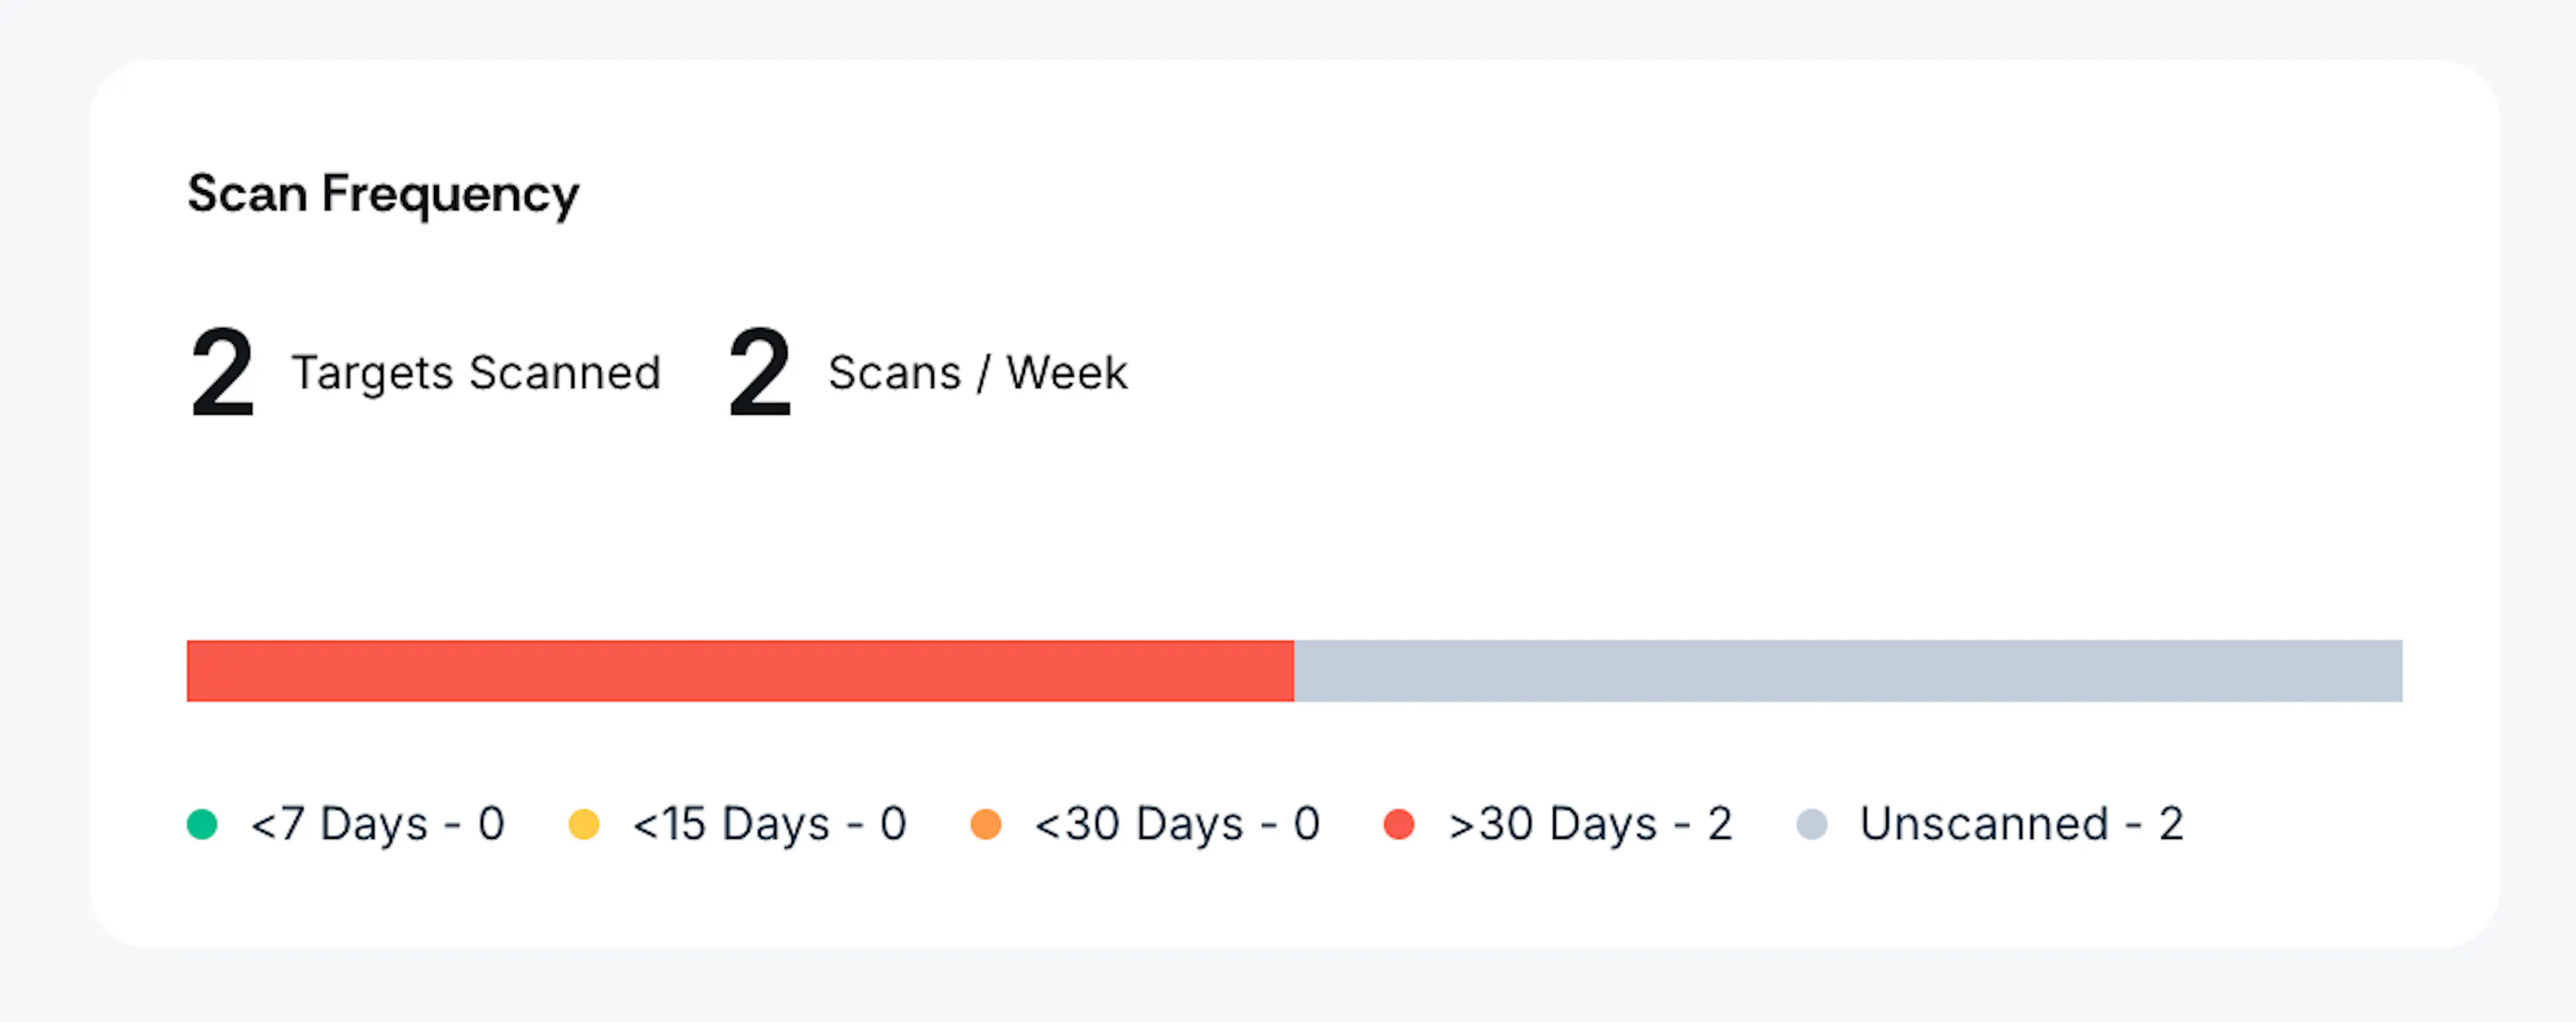
The Scan Findings chart categorizes findings by severity. Use it to prioritize remediation efforts by severity level.
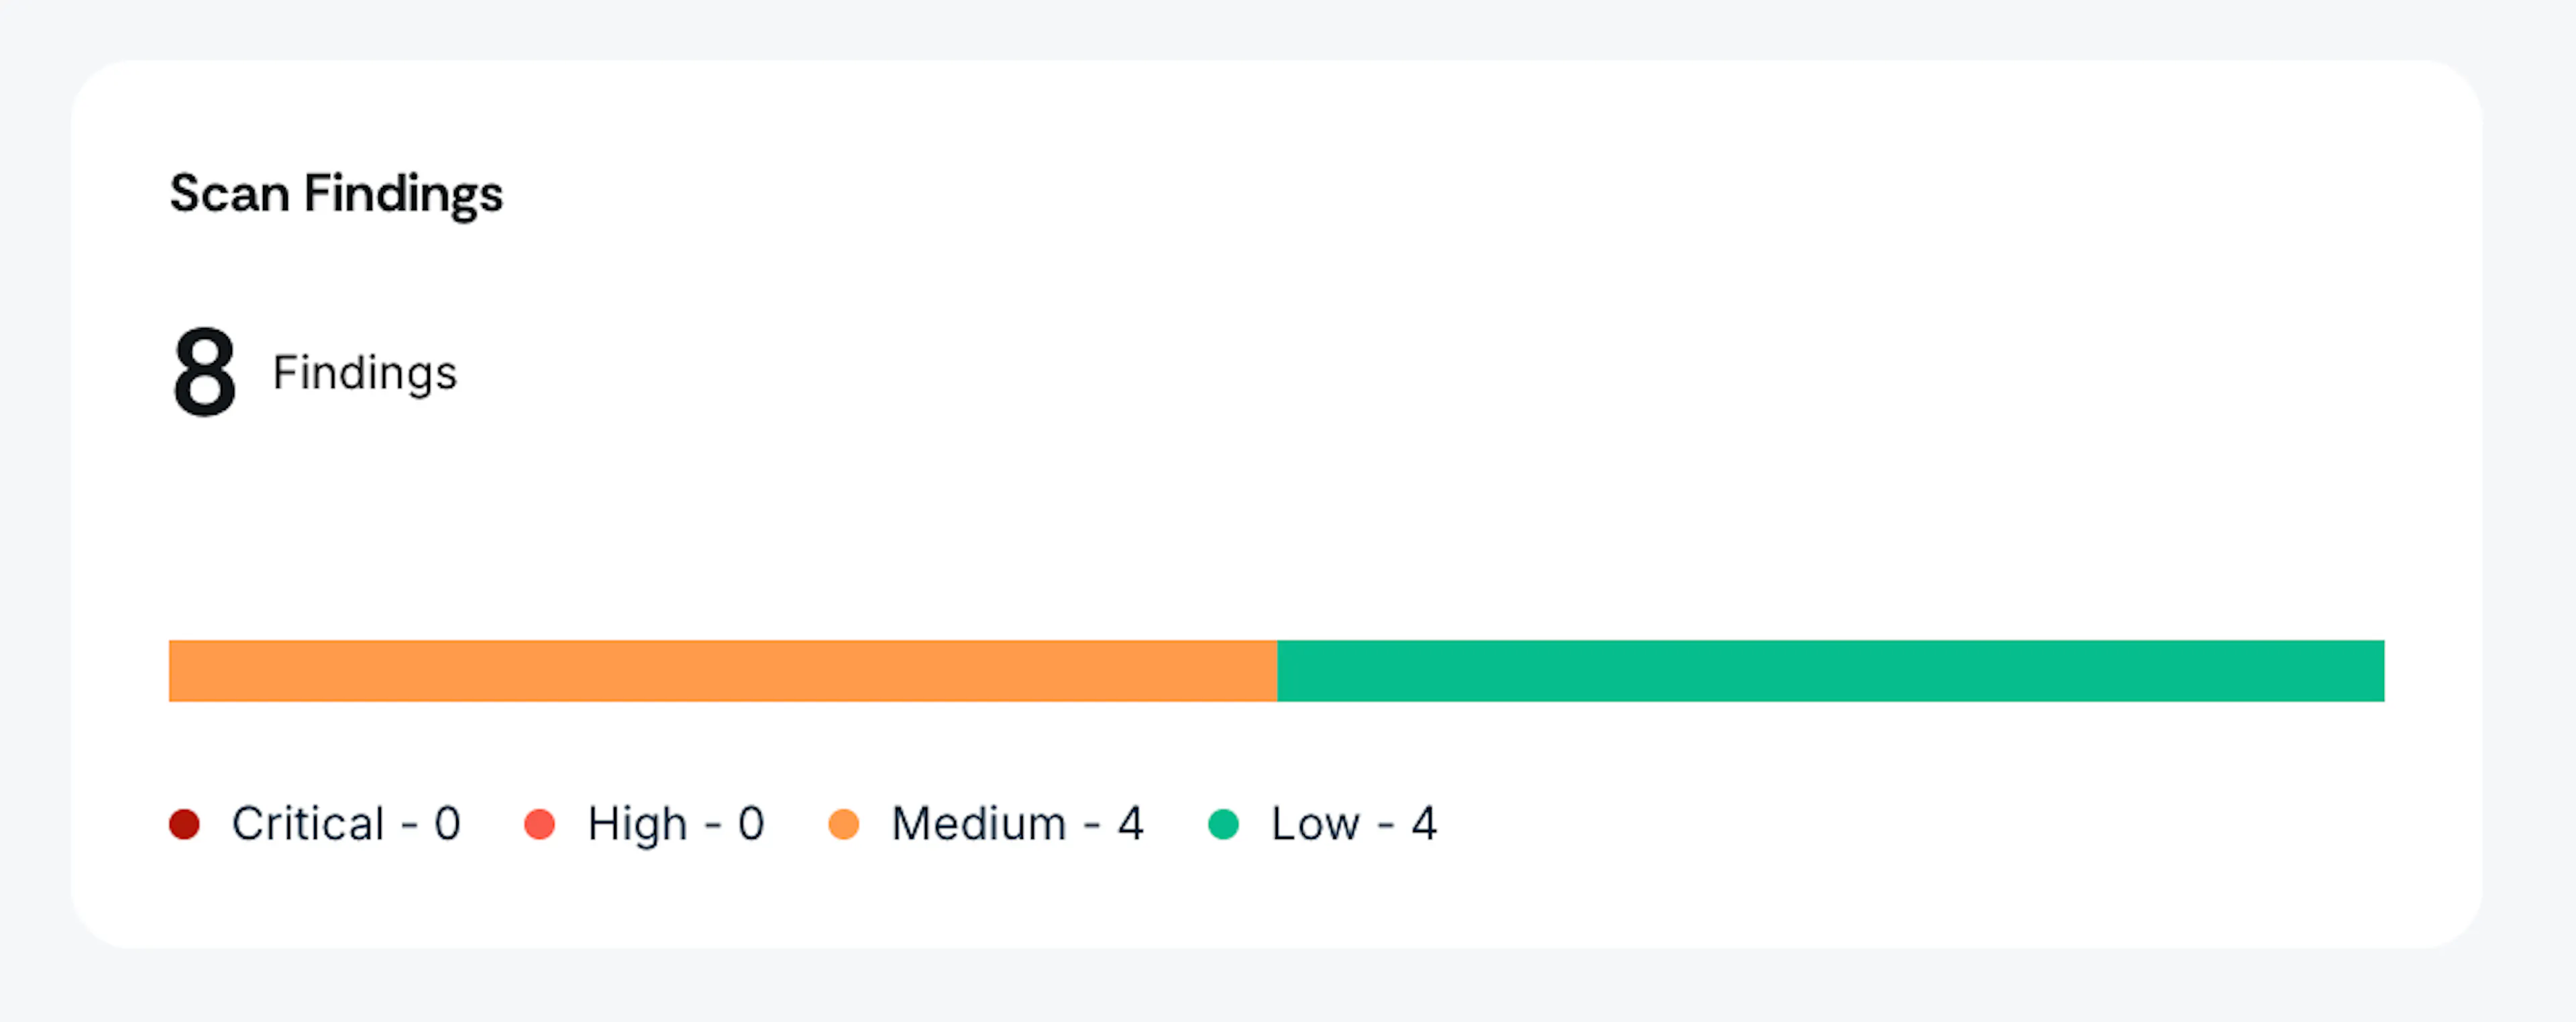
The Resources Trend graph provides a quick overview of how the risk of your targets evolves over time. Click and drag in the plot area to zoom in and out as needed. Additionally, use the Targets filter to view affected resources for specific targets.
Pro Tip!
The charts and graphs are interactive. Click them to view the underlying targets and findings.
2: All Findings Page
What you’ll see: A clickable chart of scan frequency and findings. Additionally, this page also includes a sortable table displaying every vulnerability identified across all completed scans. This comprehensive view serves as your security command center, where you can track, filter, and manage findings at scale.
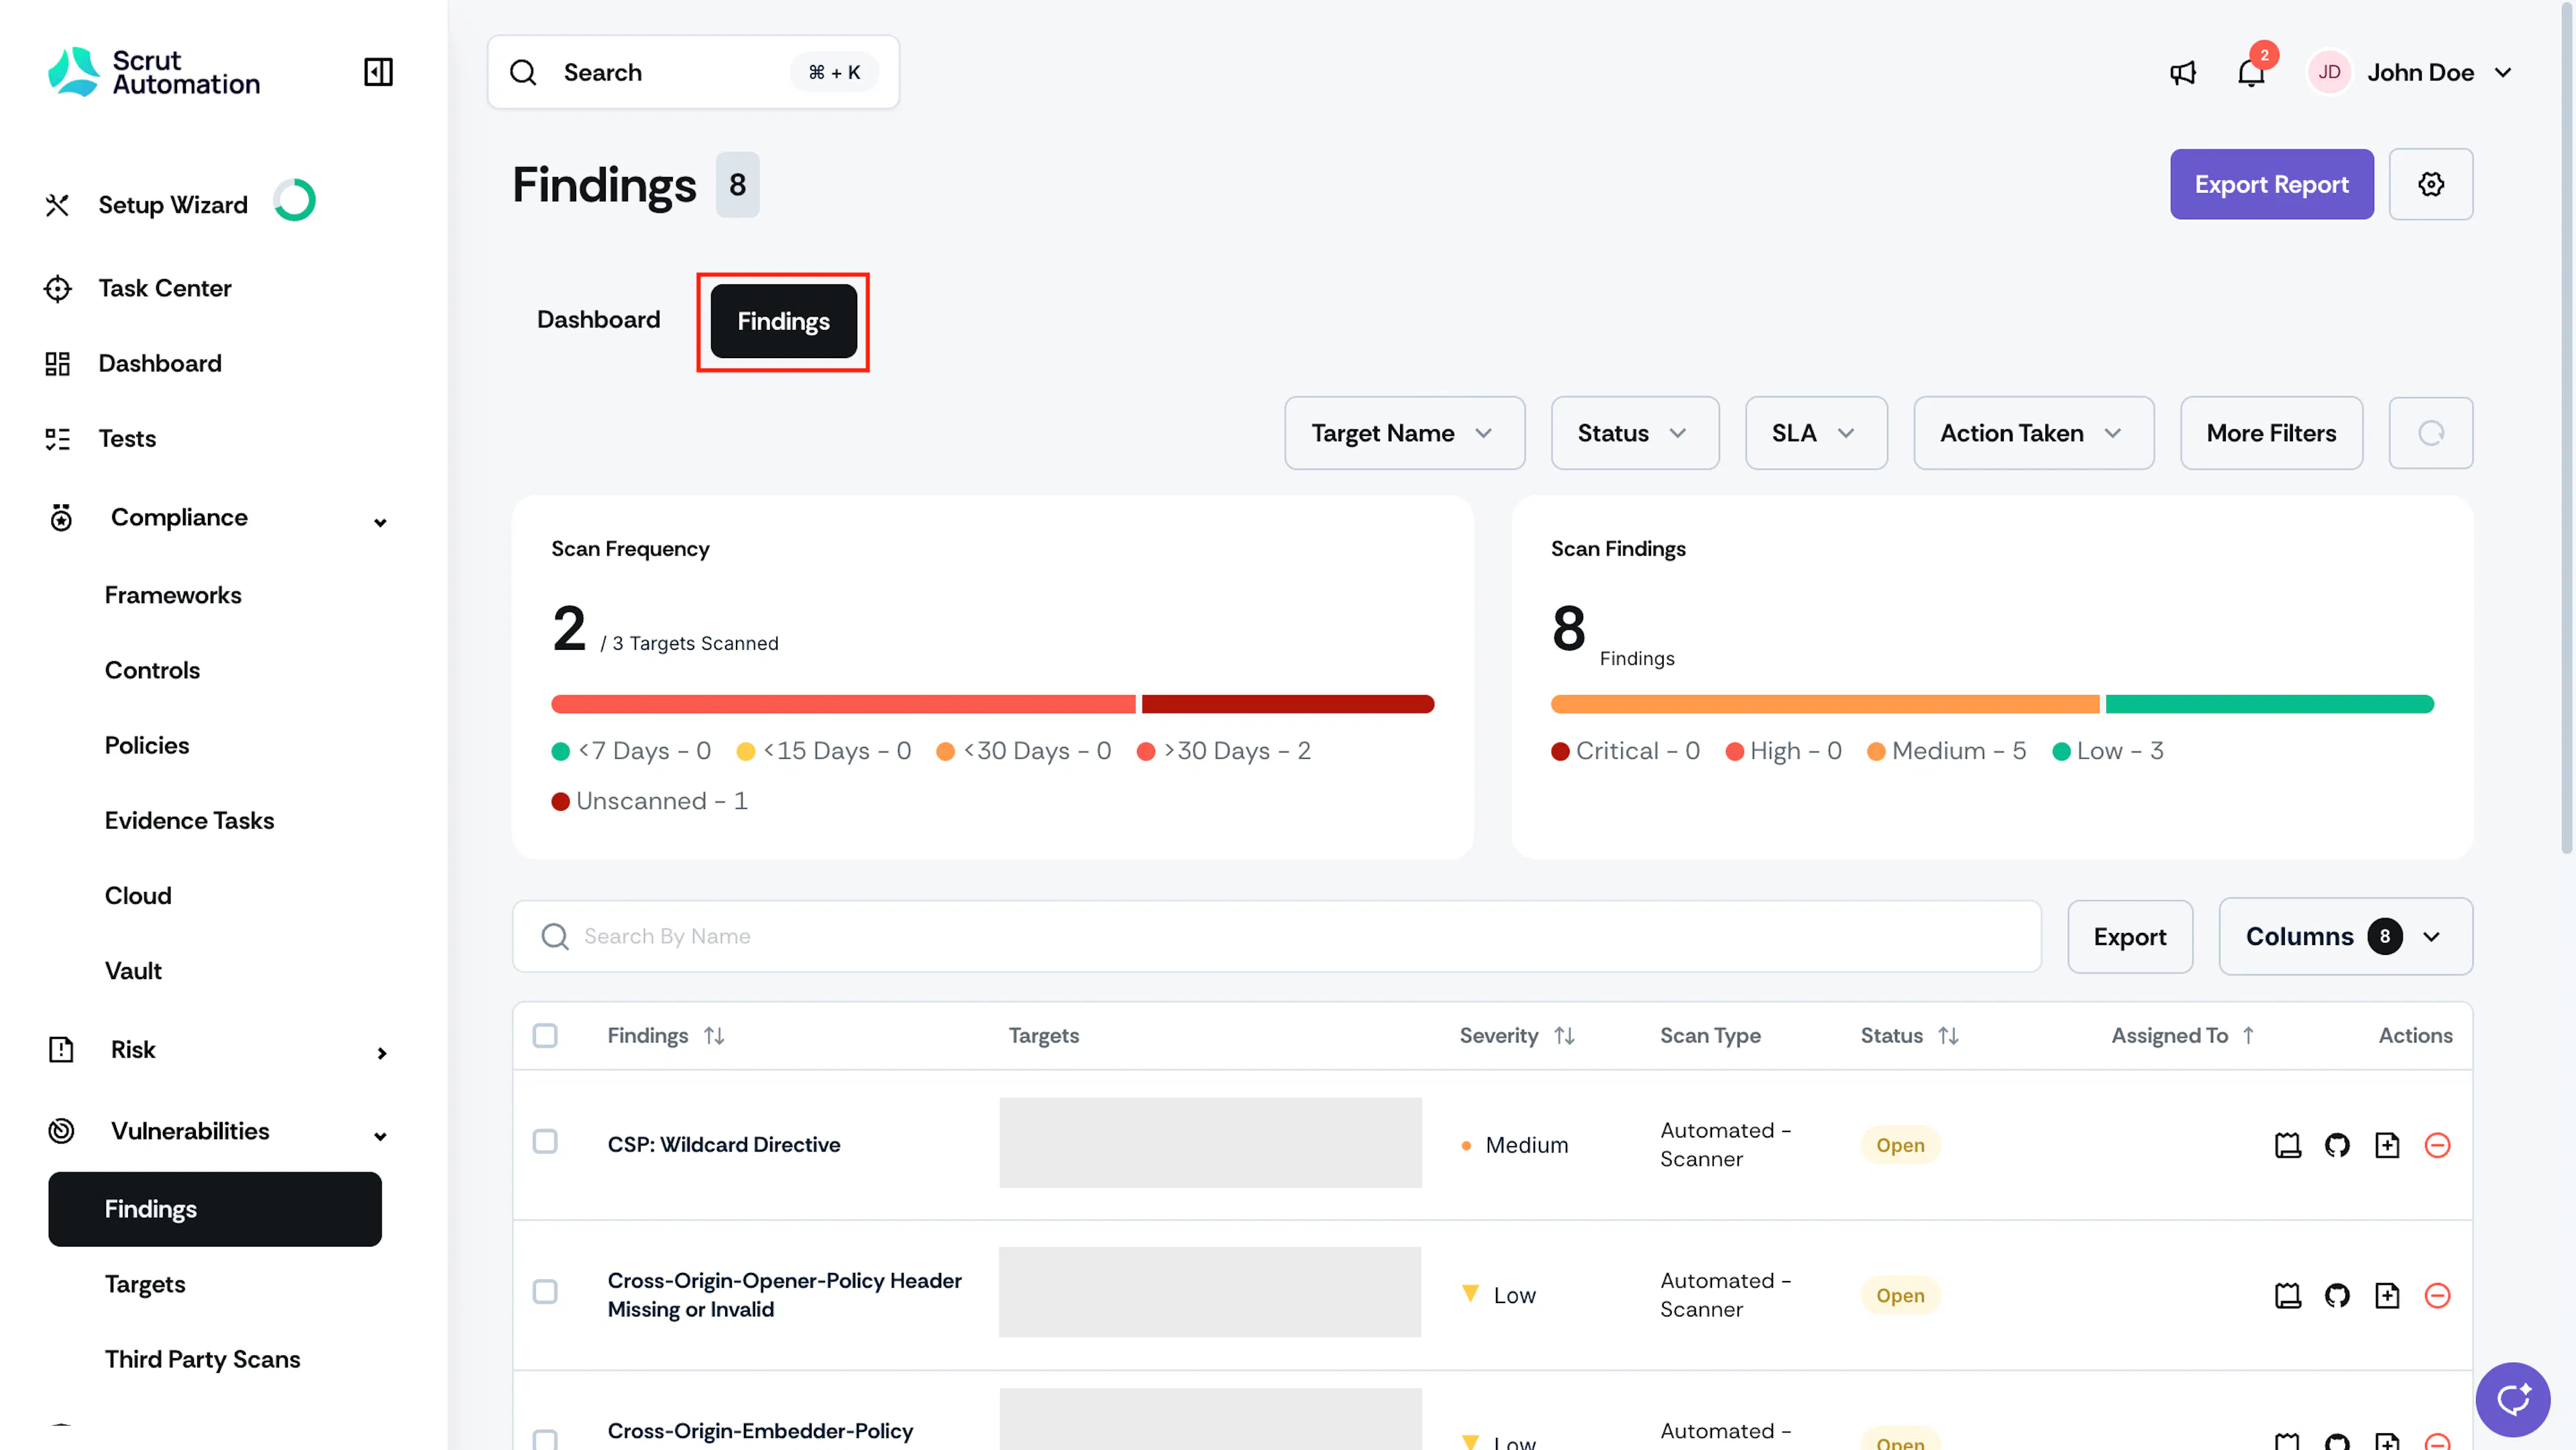
- Navigate to Vulnerabilities → Findings → All Findings to access the complete list of identified vulnerabilities from completed scans.
- Each finding is associated with a specific target and scan type. You can also find other metadata such as Severity, Status, Owner, First Seen, and SLA.
- Use the filters and column selector to refine the table based on your requirements.
- Use column sorting to prioritize findings by severity, and review each finding's details on the details page.
Pro Tip!
Clicking any finding takes you to the finding details page, where you can find more information.
3: Findings Details Page
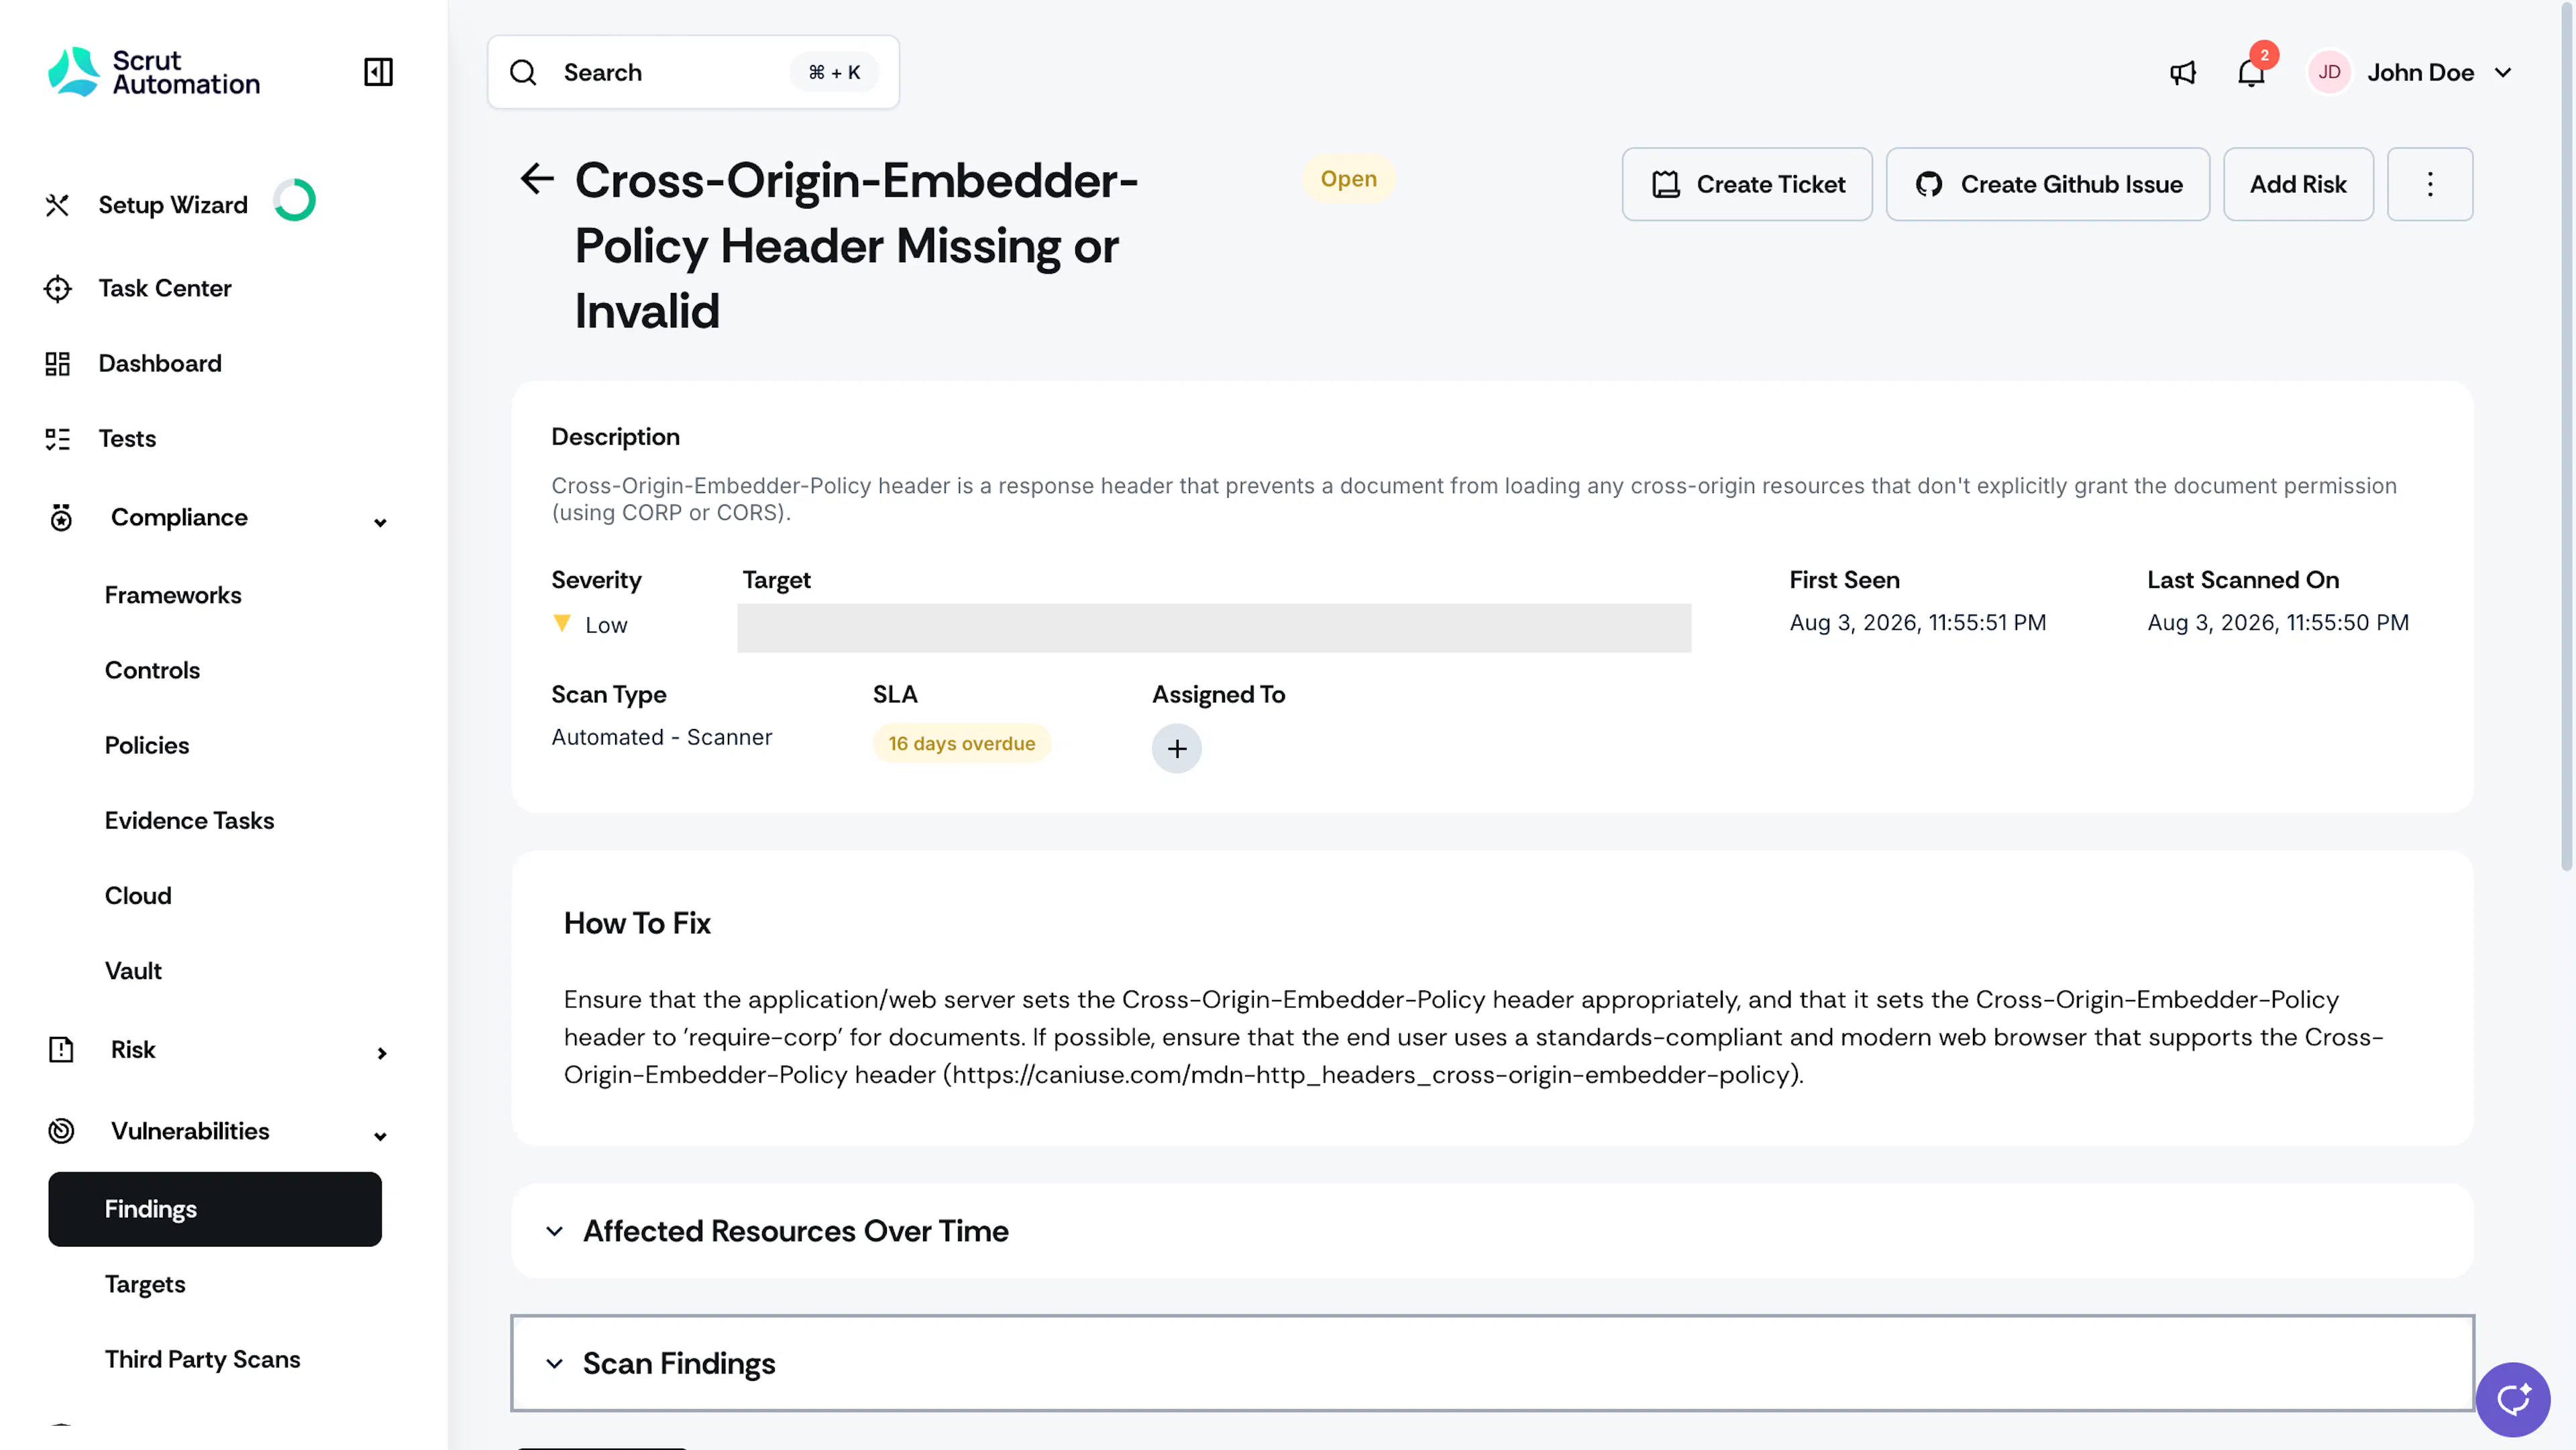
What you'll see: In-depth information on each vulnerability, consolidating all technical details, remediation guidance, and affected resources. This page helps you understand and resolve each identified vulnerability.
- Click on any individual finding to open its corresponding finding details page.
- The findings page lists comprehensive details, including:
- Vulnerability description, severity, target, first seen, last scanned on, scan type, SLA, and assigned user
- Steps on how to fix the discovered vulnerability
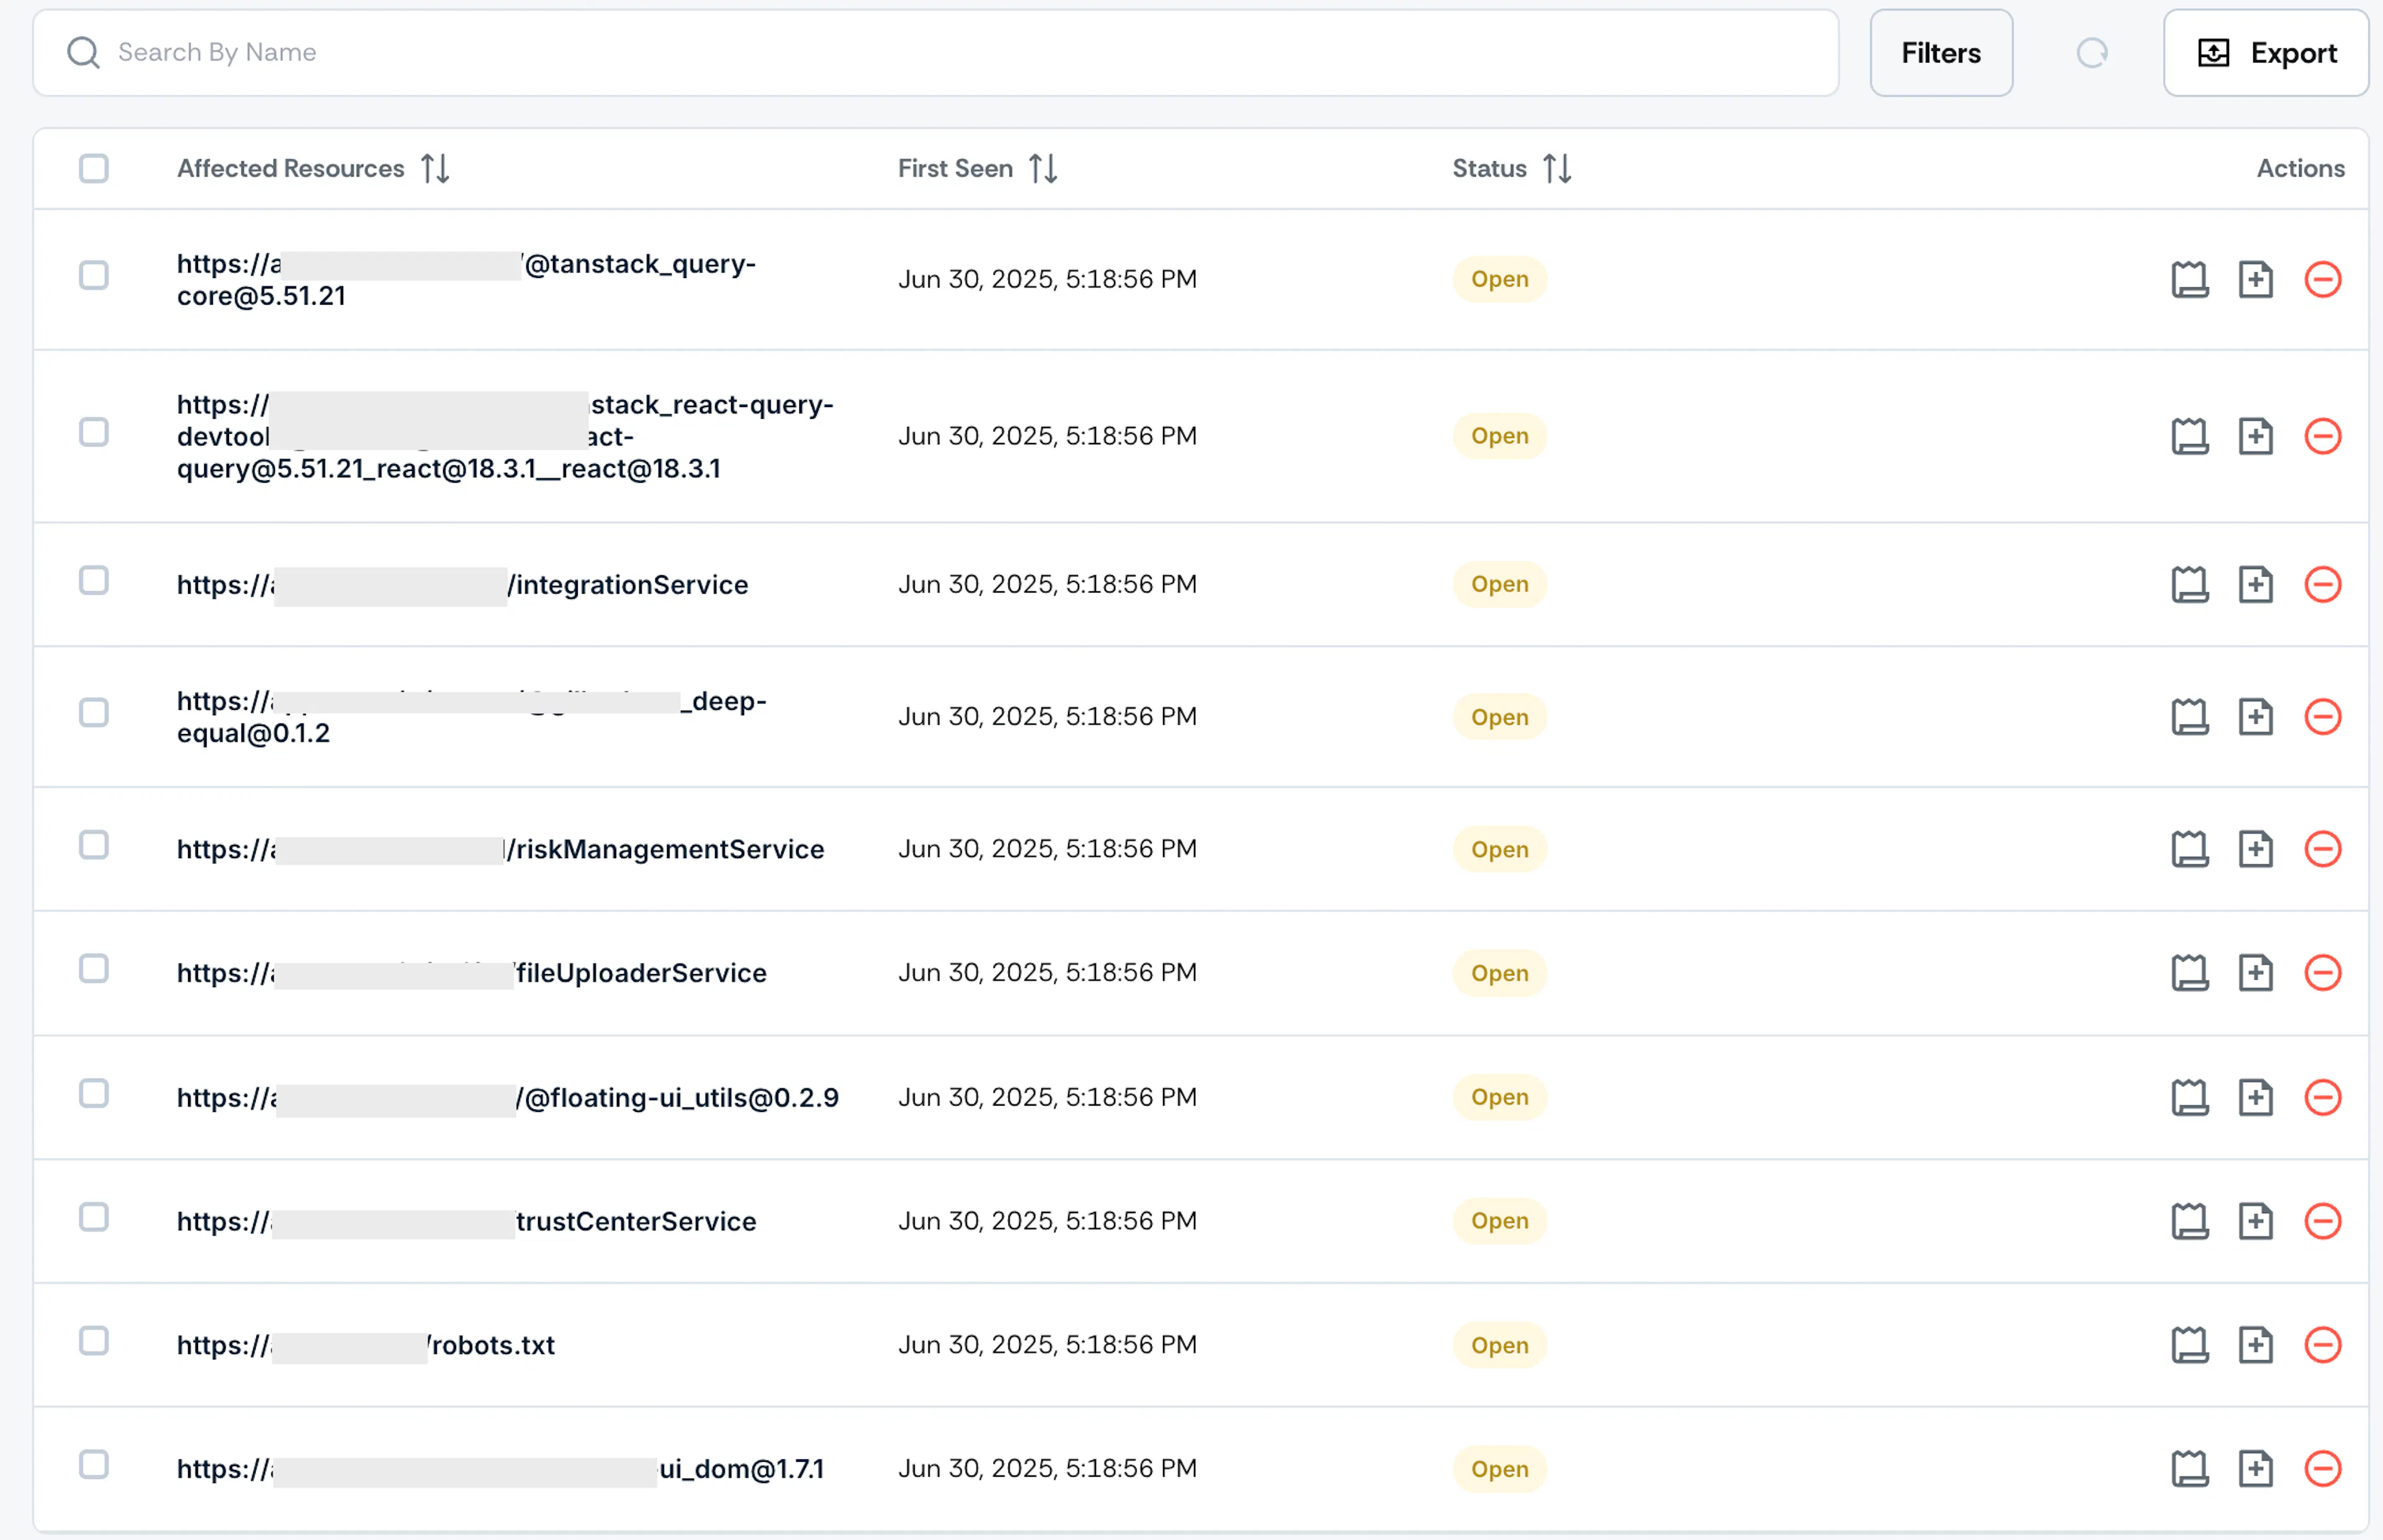
- Resources affected over time
- Table listing all affected resources and their metadata, including first seen, status, and other details.
- Linked tickets and linked risks
- Comments and audit logs
4: Scanned Resources
What you’ll see: Full list of scanned URLs for each scan
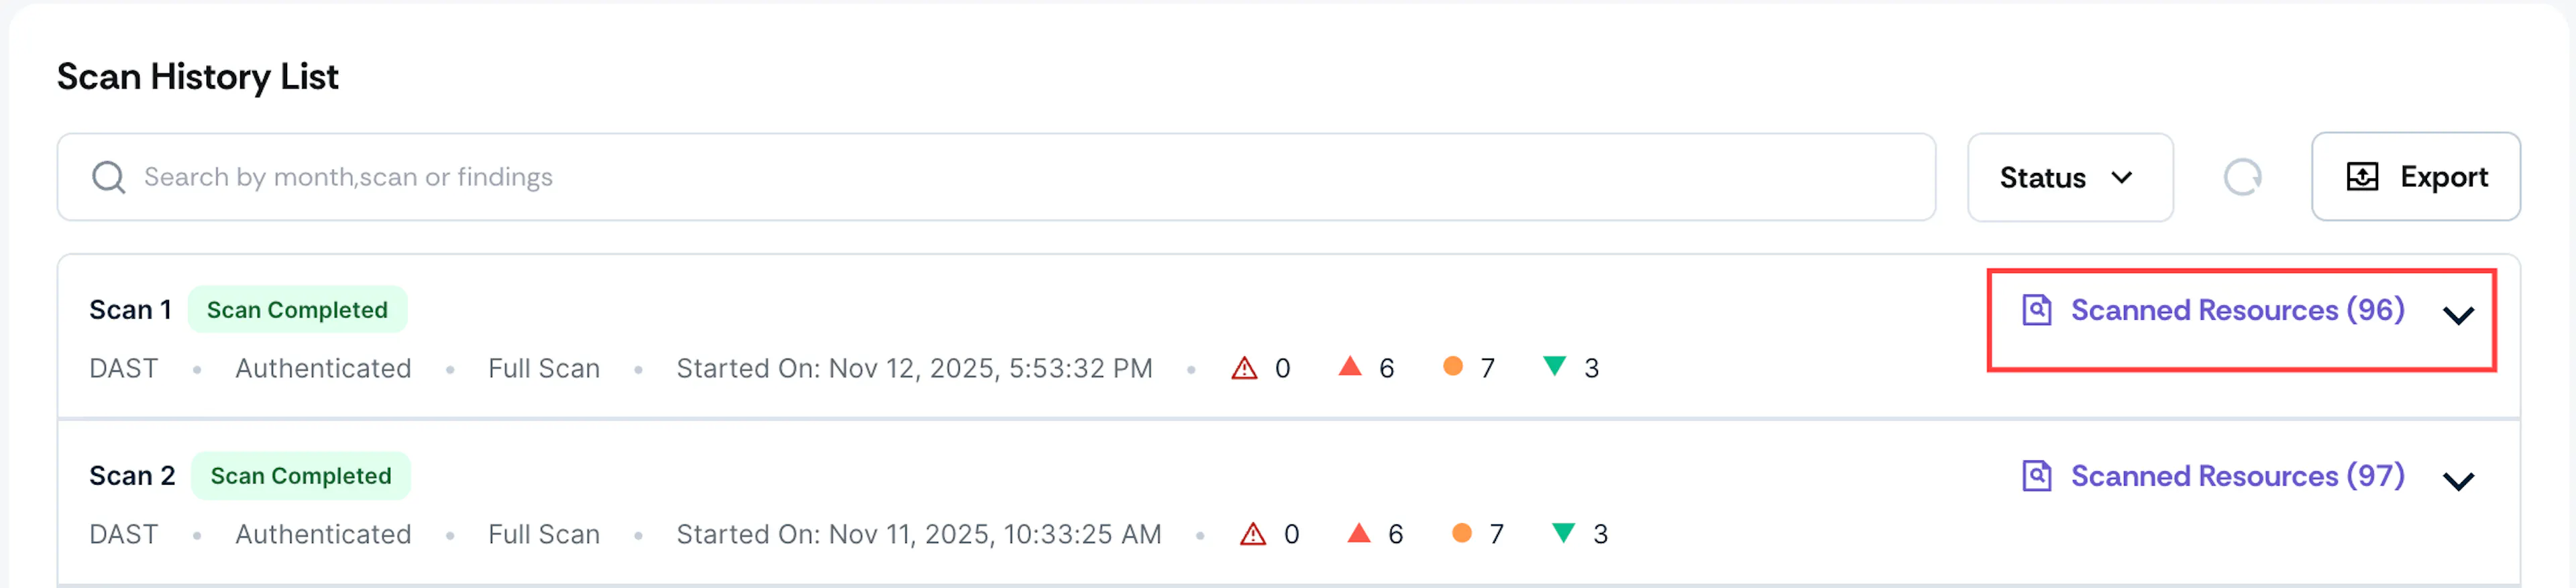
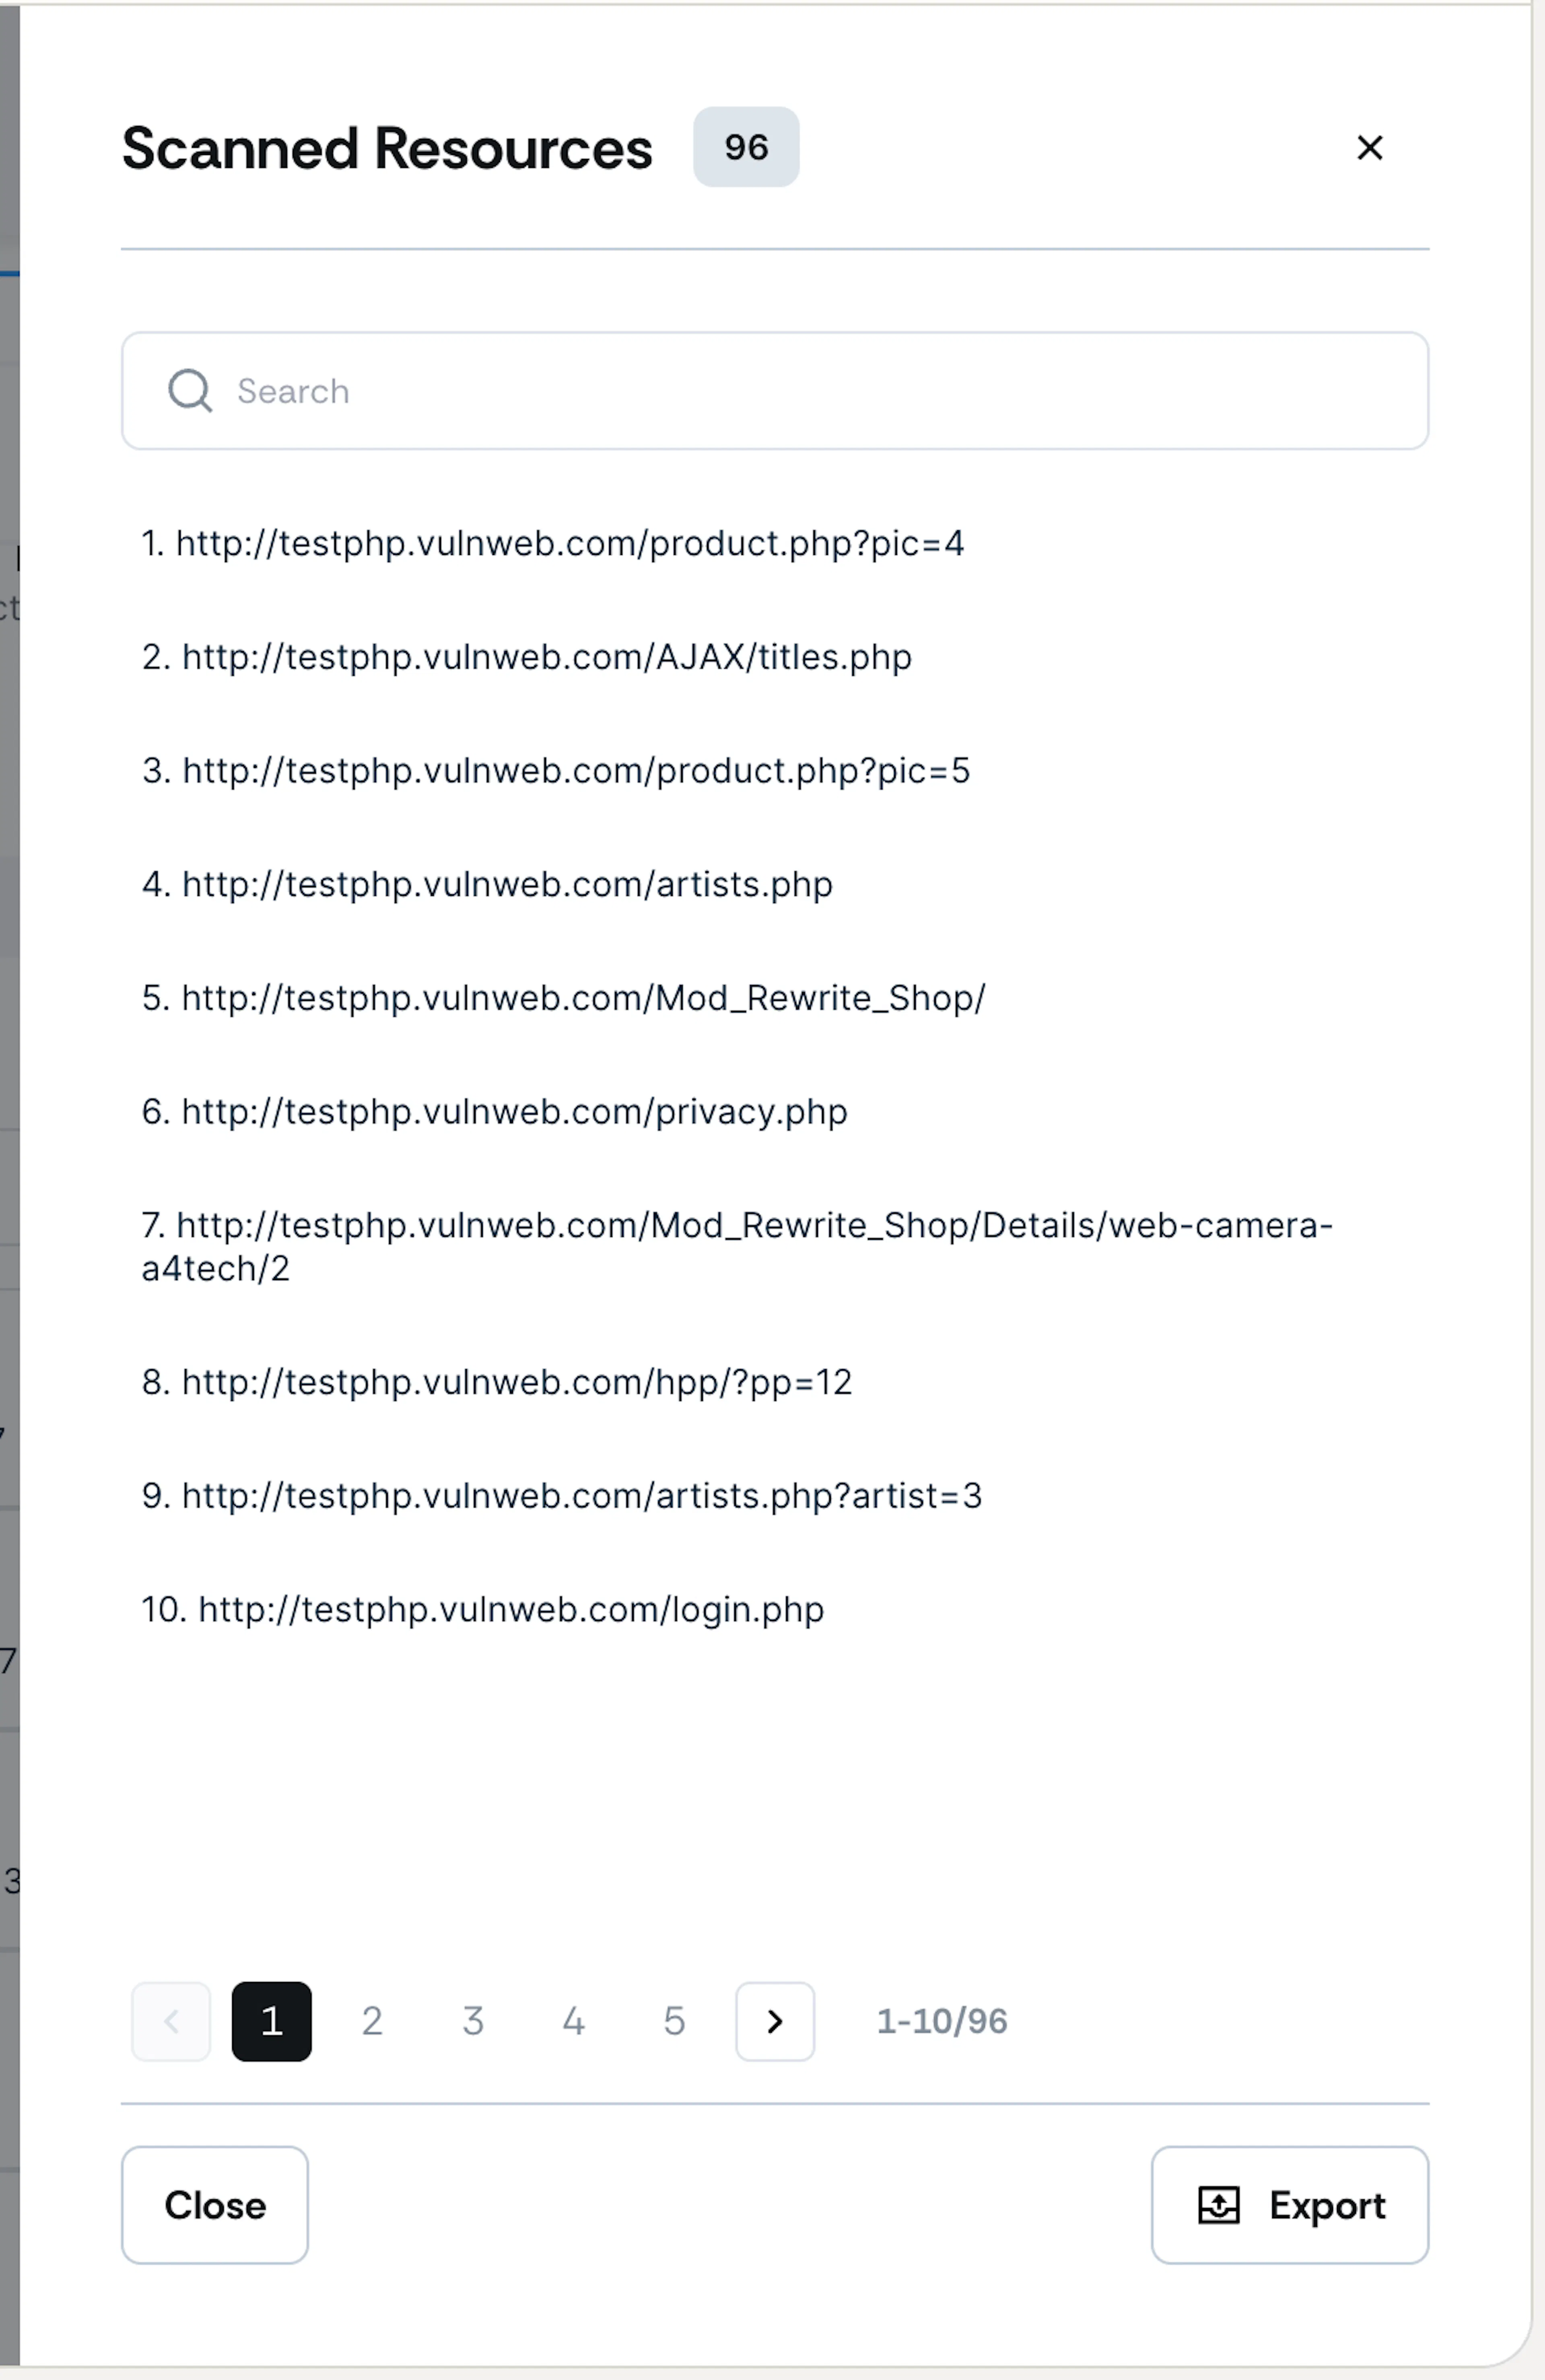
To provide complete transparency into what Scrut actually tests during each scan, we display the full list of scanned URLs in the scan results. This helps you understand the scope and depth of the scan, eliminating ambiguity about what was and wasn't tested.
During a typical scan, the crawler discovers many URLs across the target application. However, not all discovered URLs are suitable or safe to scan. Scrut applies intelligent filtering to ensure it tests only relevant, valid URLs for vulnerabilities.
Navigate to Vulnerabilities → Targets and click on a specific scan. Once you’re on the scan details page, scroll to the Scan History List section and look for the Scanned Resources button. It shows the number of URLs scanned, and clicking it opens the complete list.
5: Trace Details (Via the Affected Resources Table)
What you'll see: Technical evidence and request/response data for each vulnerable resource.
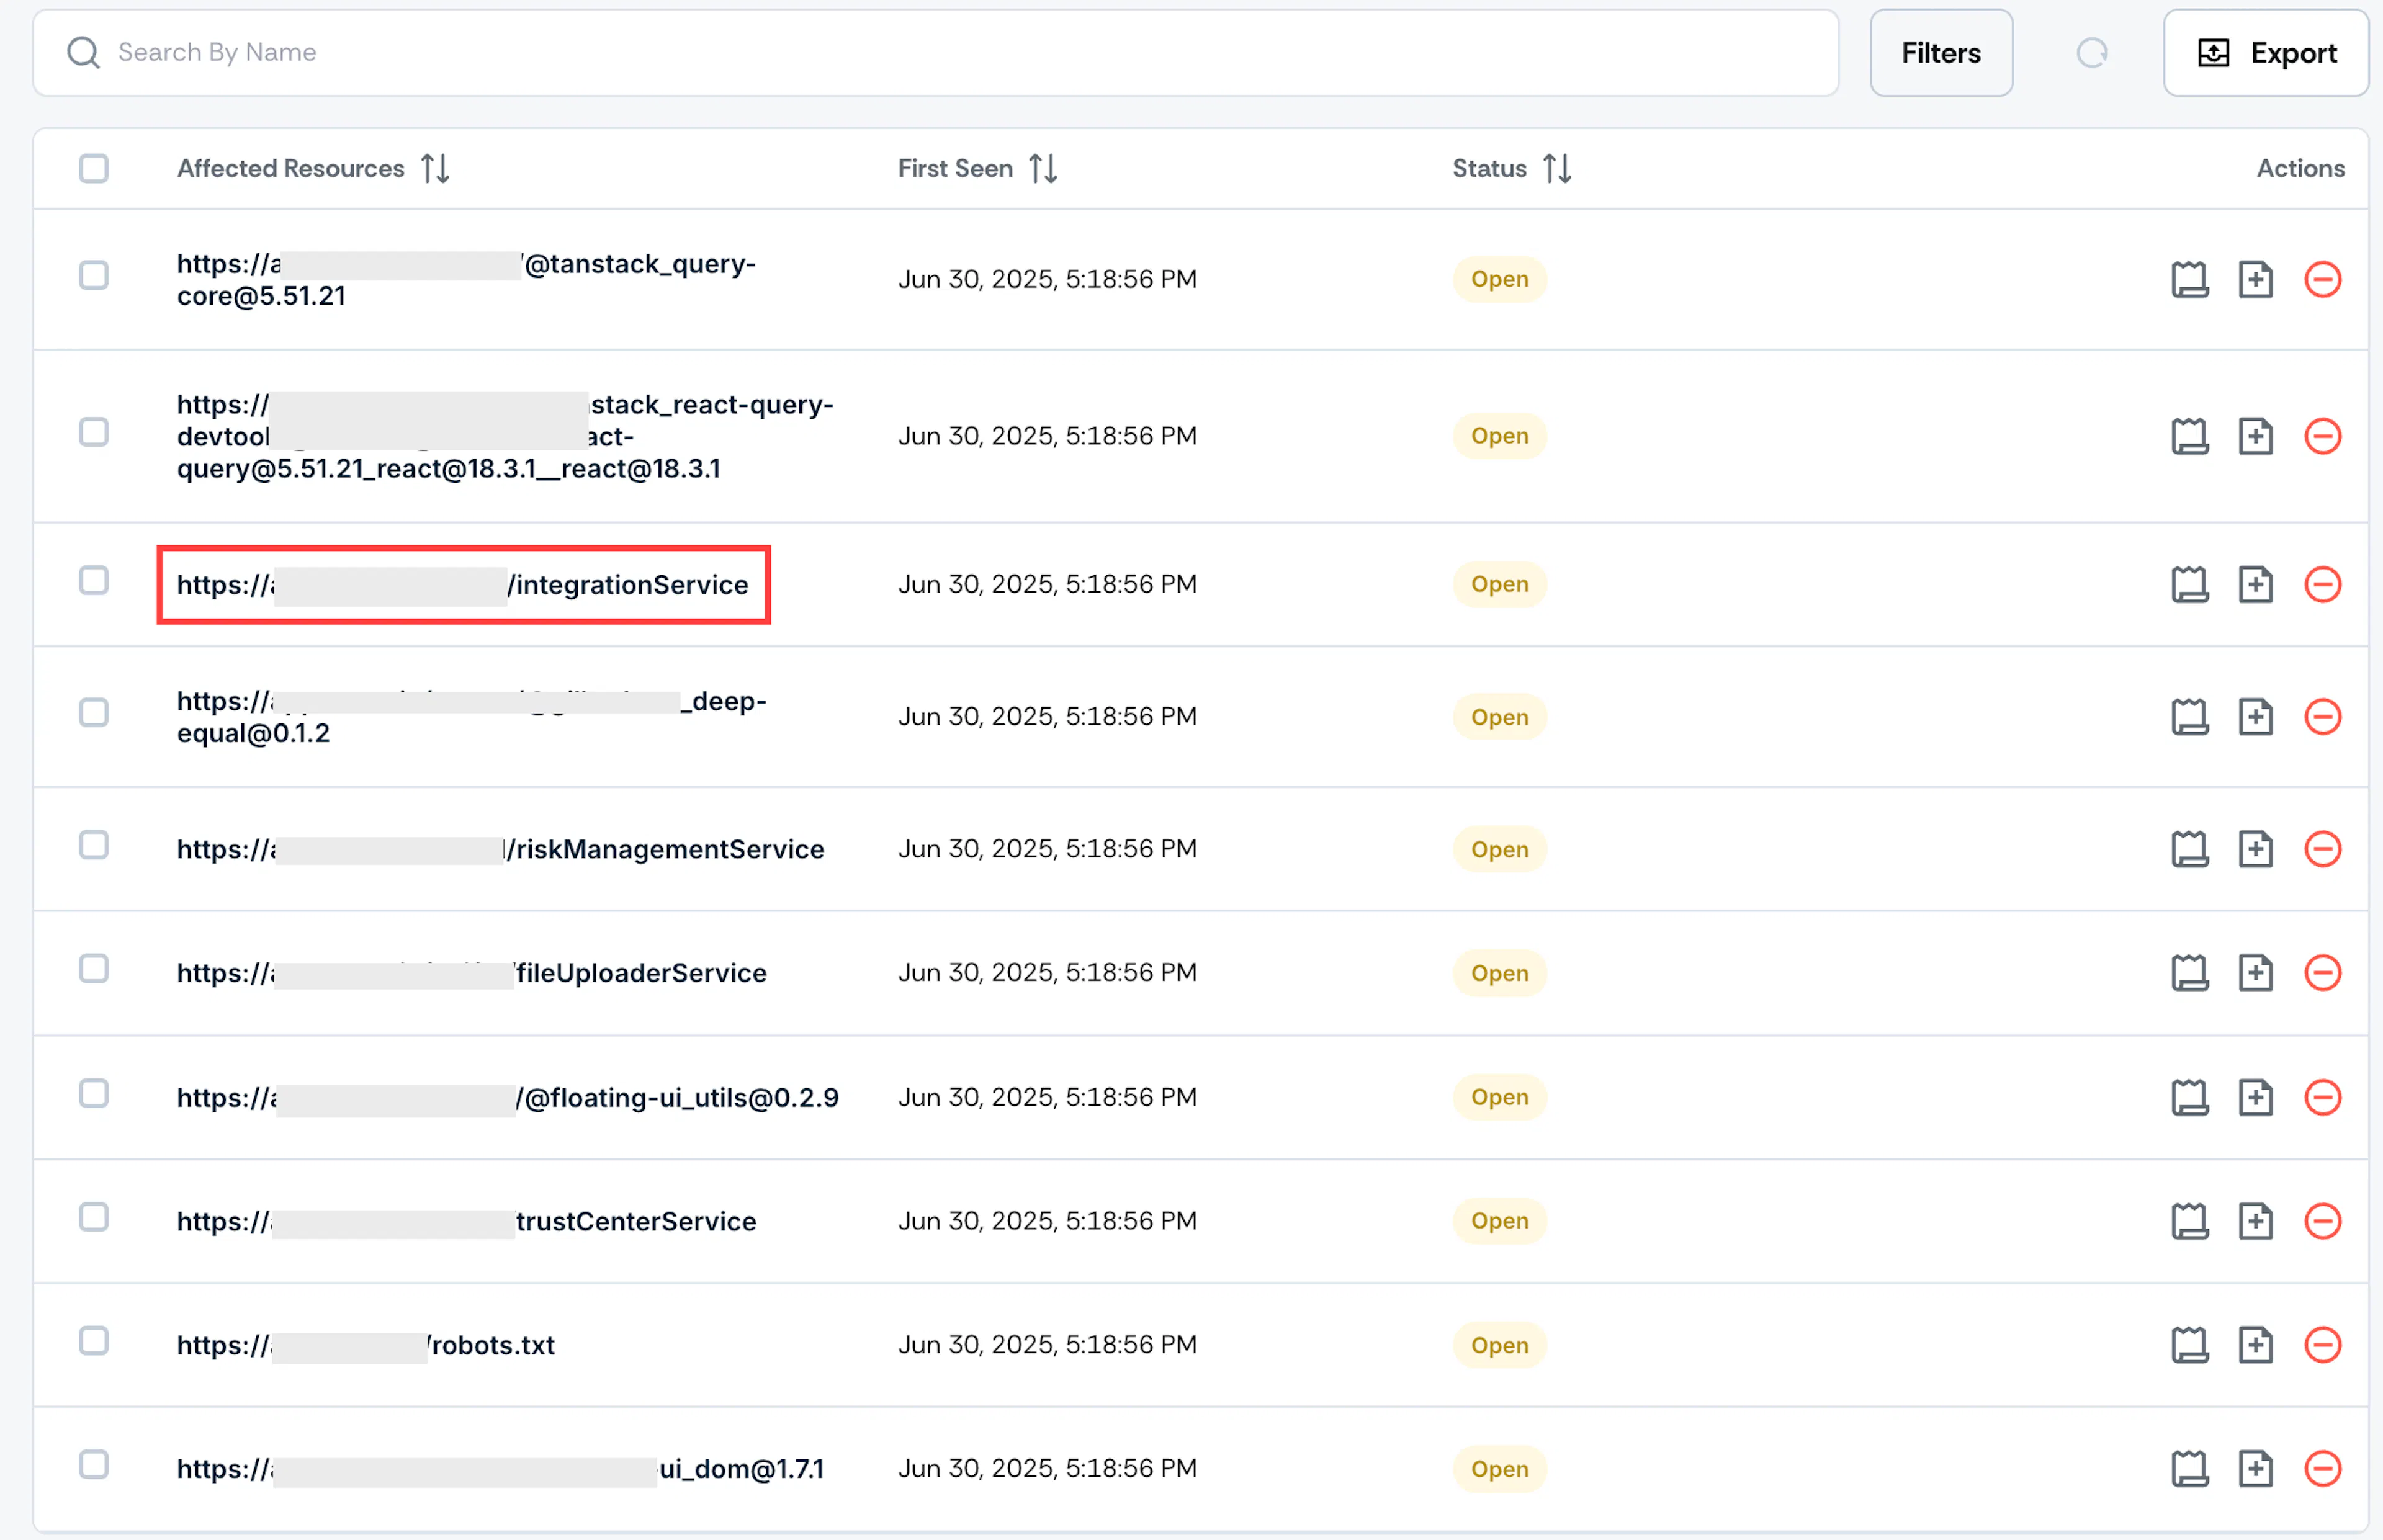
The Scan Finding table on the Findings details page provides an overview of all resources impacted by scan findings. To view detailed information about a specific resource, click on any row in the table to open a side drawer with comprehensive Trace Details.
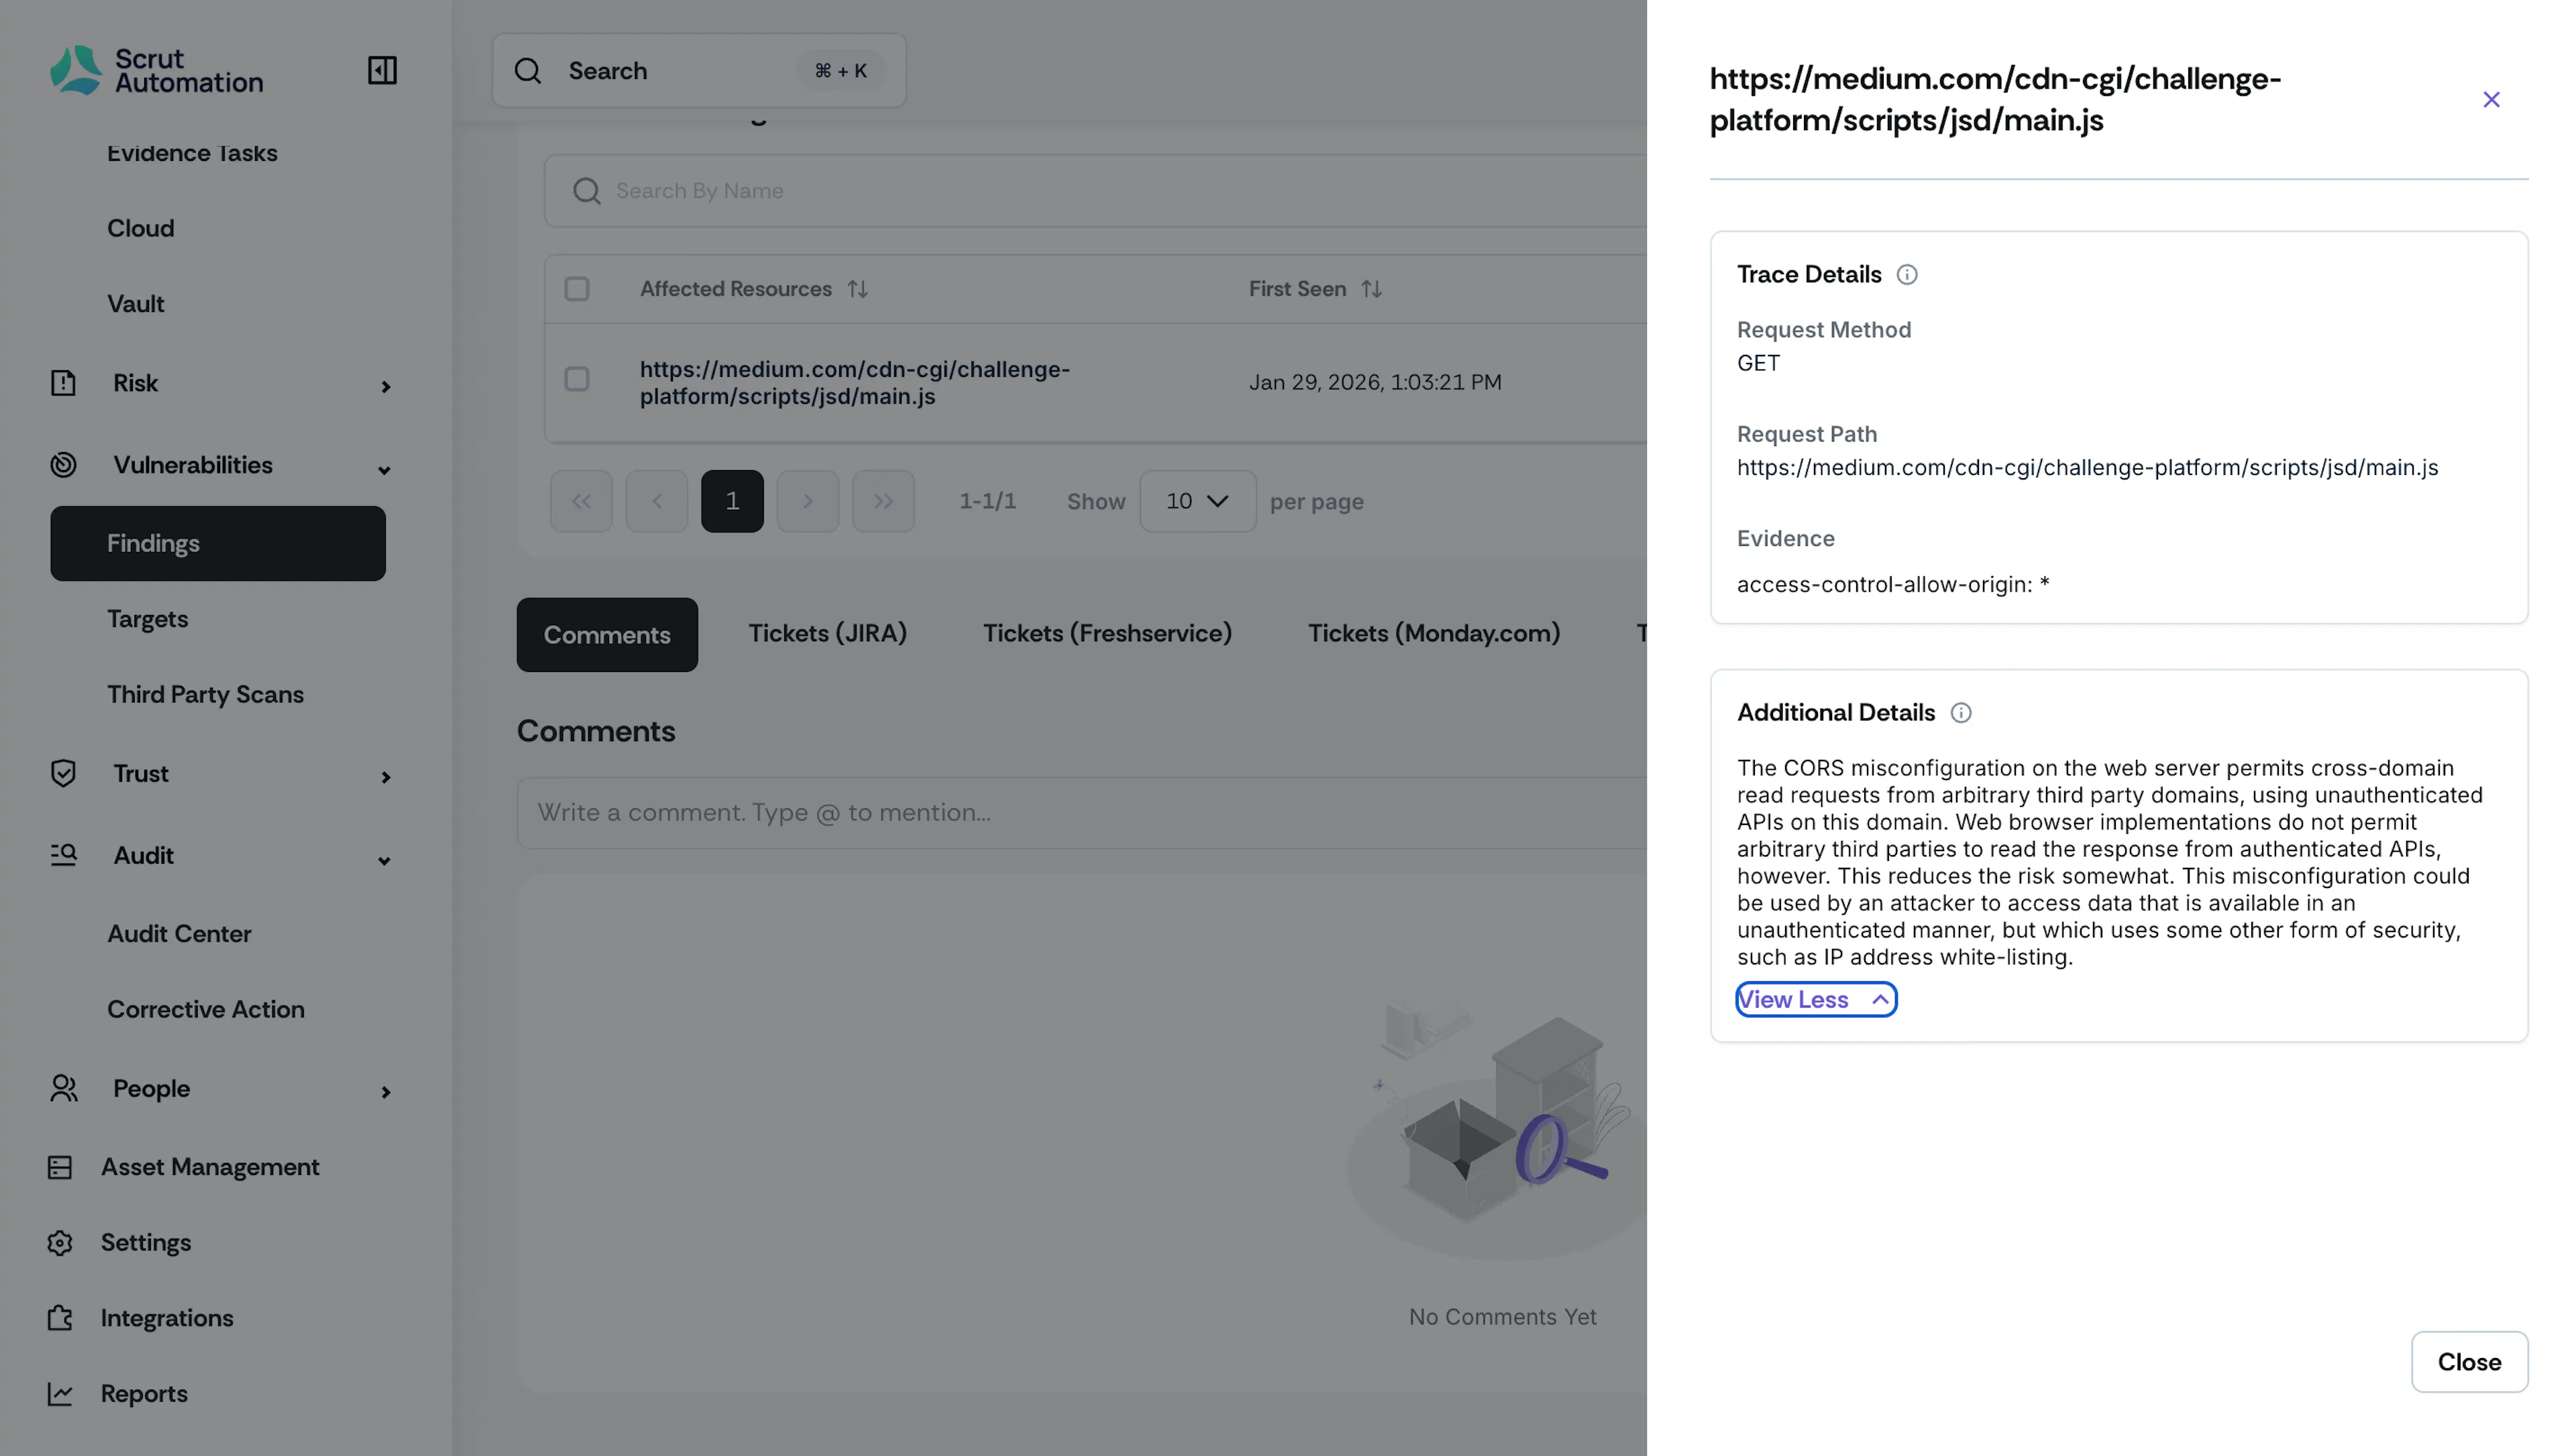
This includes trace records of what was sent to the application during the scan, providing context for the finding and allowing reproduction if needed. The response evidence is taken directly from the server’s reply, showing what was observed and confirming the vulnerability. When you click on any affected resource, a drawer opens displaying the following information:
- The header shows the full path to the affected resource
- The request section provides details about the HTTP request that triggered the findings:
- Method: The HTTP method used (GET, POST, PUT, DELETE, etc.)
- Path: The specific endpoint that was scanned
- Parameters: Key-value pairs showing all parameters sent with the request
- The evidence section displays concrete proof captured by the scanner that demonstrates the vulnerability:
- Proof String: The exact evidence found (e.g., vulnerable library version, header mismatch,
unsafe-inlinedirective)
- Proof String: The exact evidence found (e.g., vulnerable library version, header mismatch,
- Additional details from the scan engine, including:
- CVE identifiers (displayed as clickable links)
- Reference URLs (displayed as clickable links)
- Additional context about the finding
Note:
If the scanner does not return data for a specific section, that section will not be visible in the drawer.