

Understand the Third-Party Scans Page
Who can use this feature
- Supported on Foundation, Growth, and Scale plans
The Vulnerabilities → Third-Party Scans page consolidates all vulnerabilities detected by your integrated scanning tools. Use the:
- Findings tab to triage individual vulnerabilities
- Resources tab to identify assets that carry the most exposure across your infrastructure
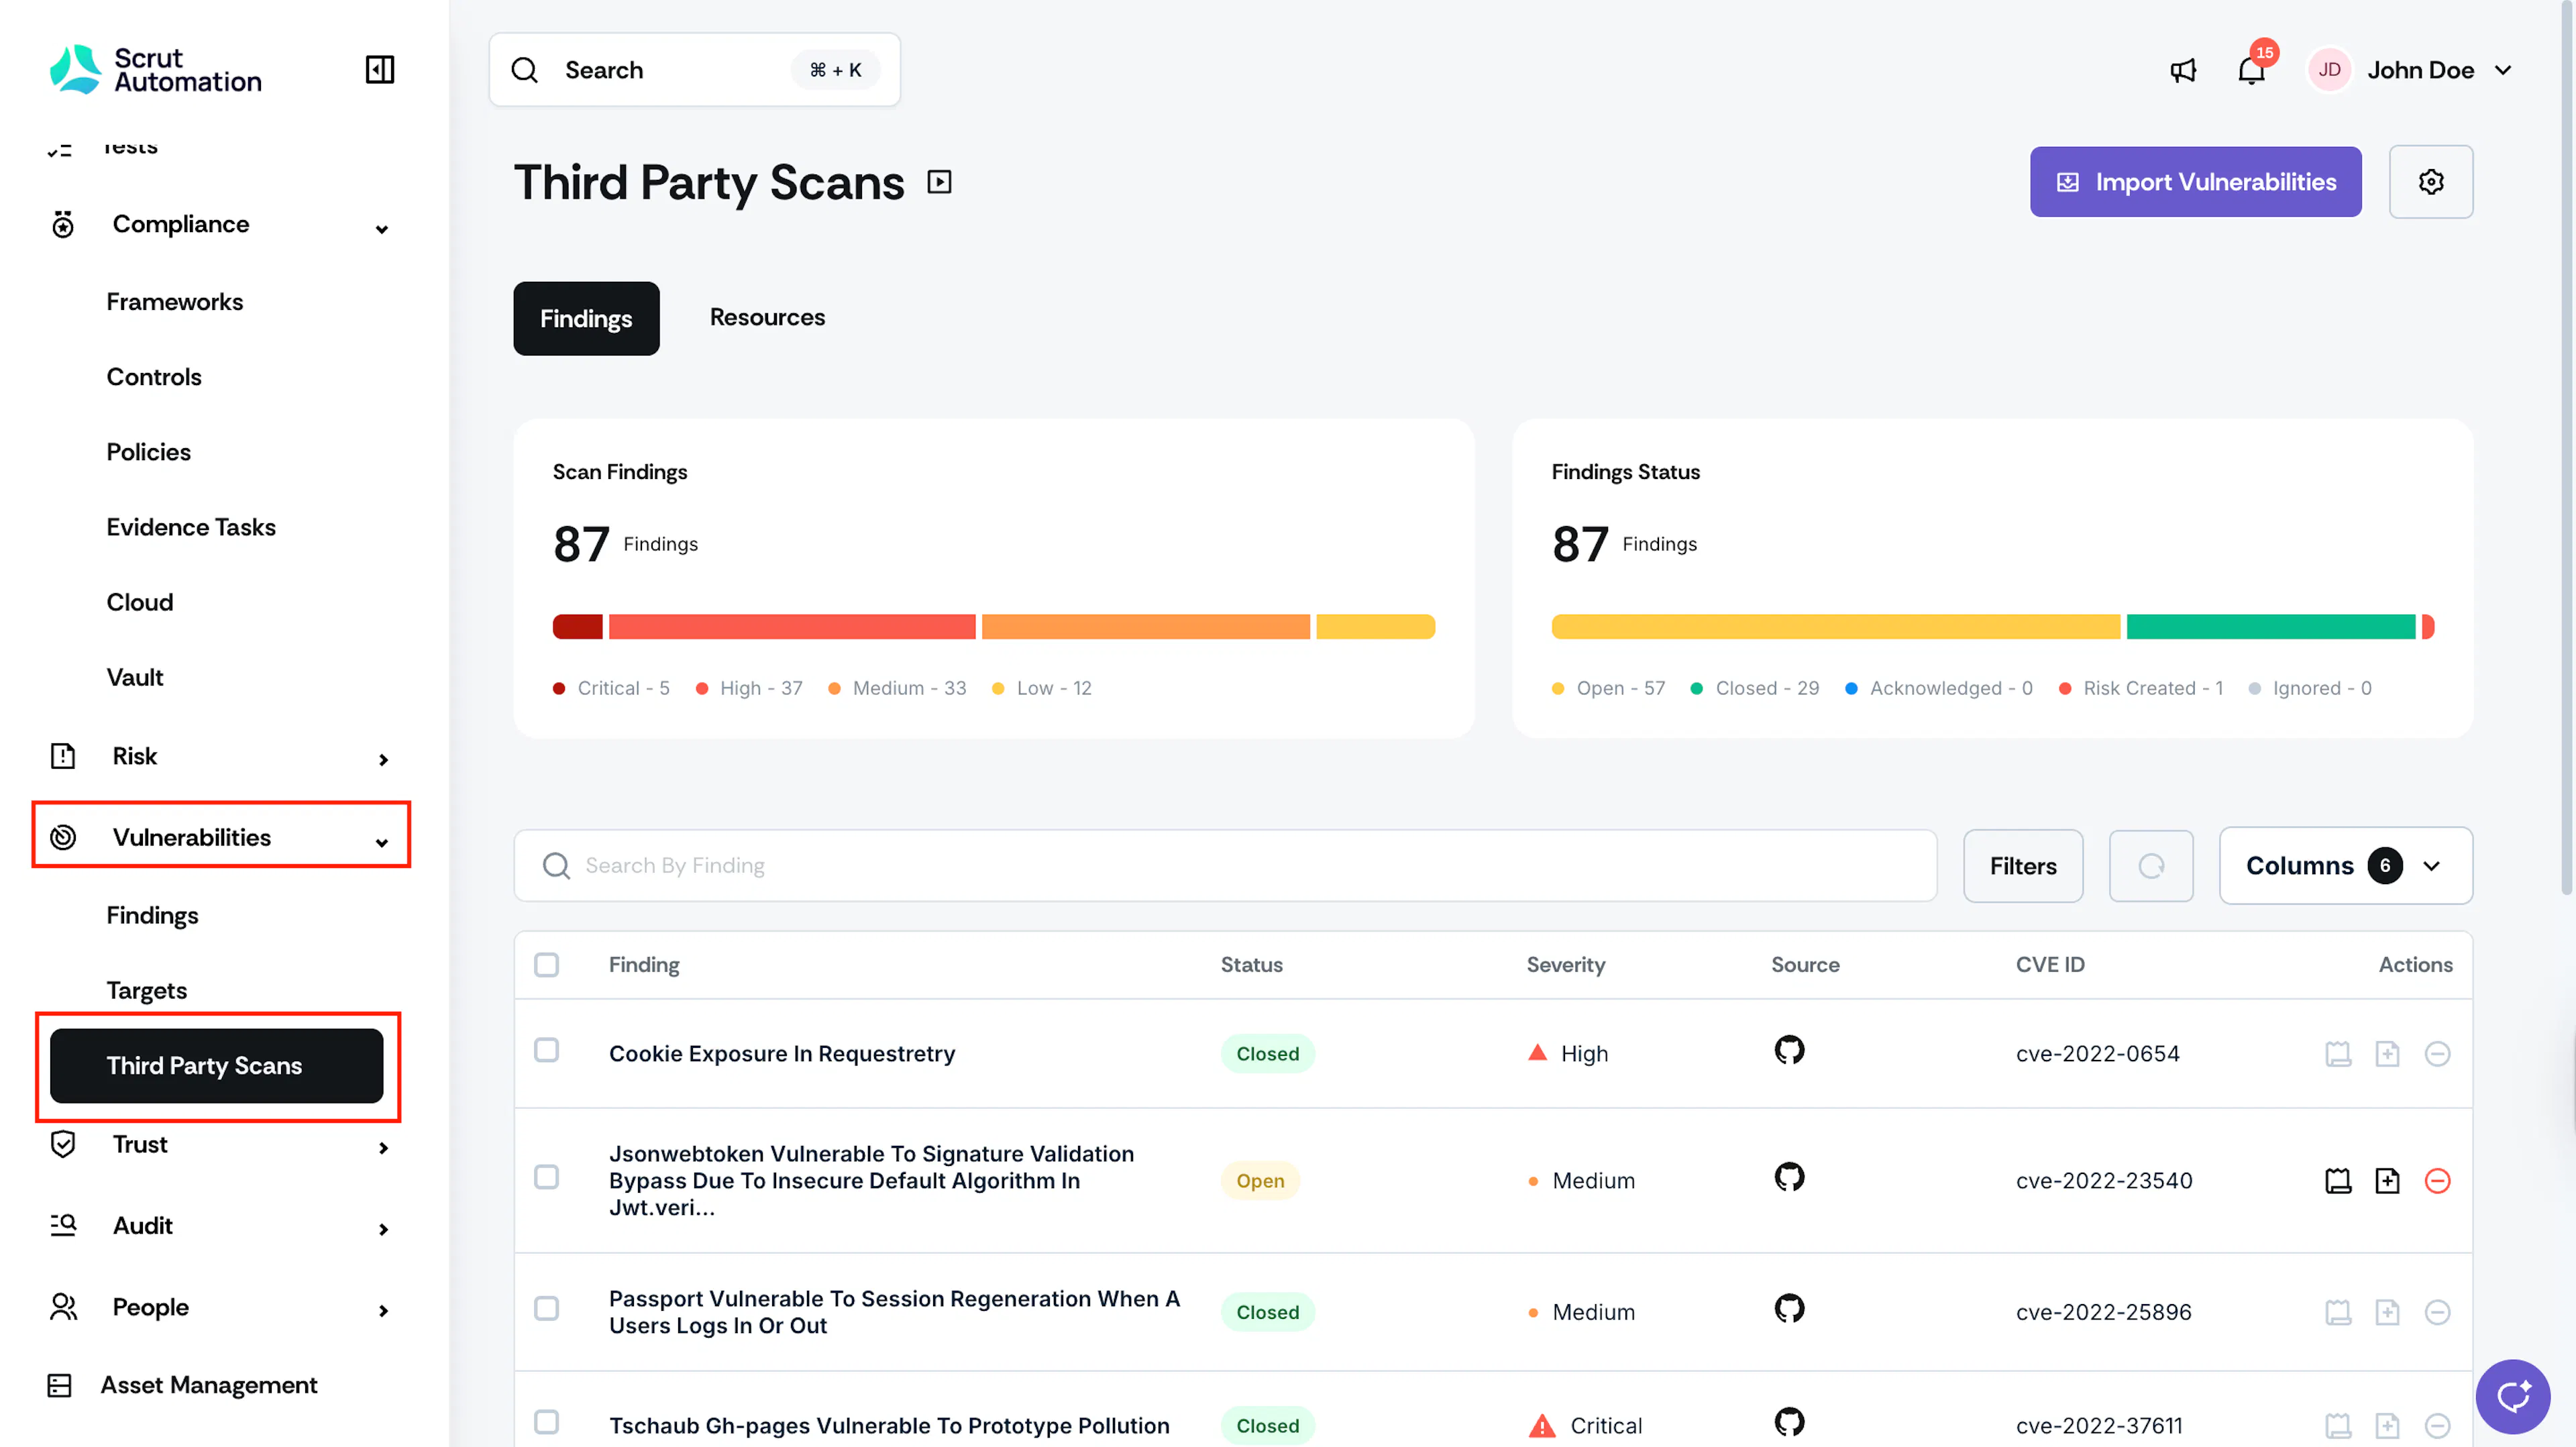
Findings Tab
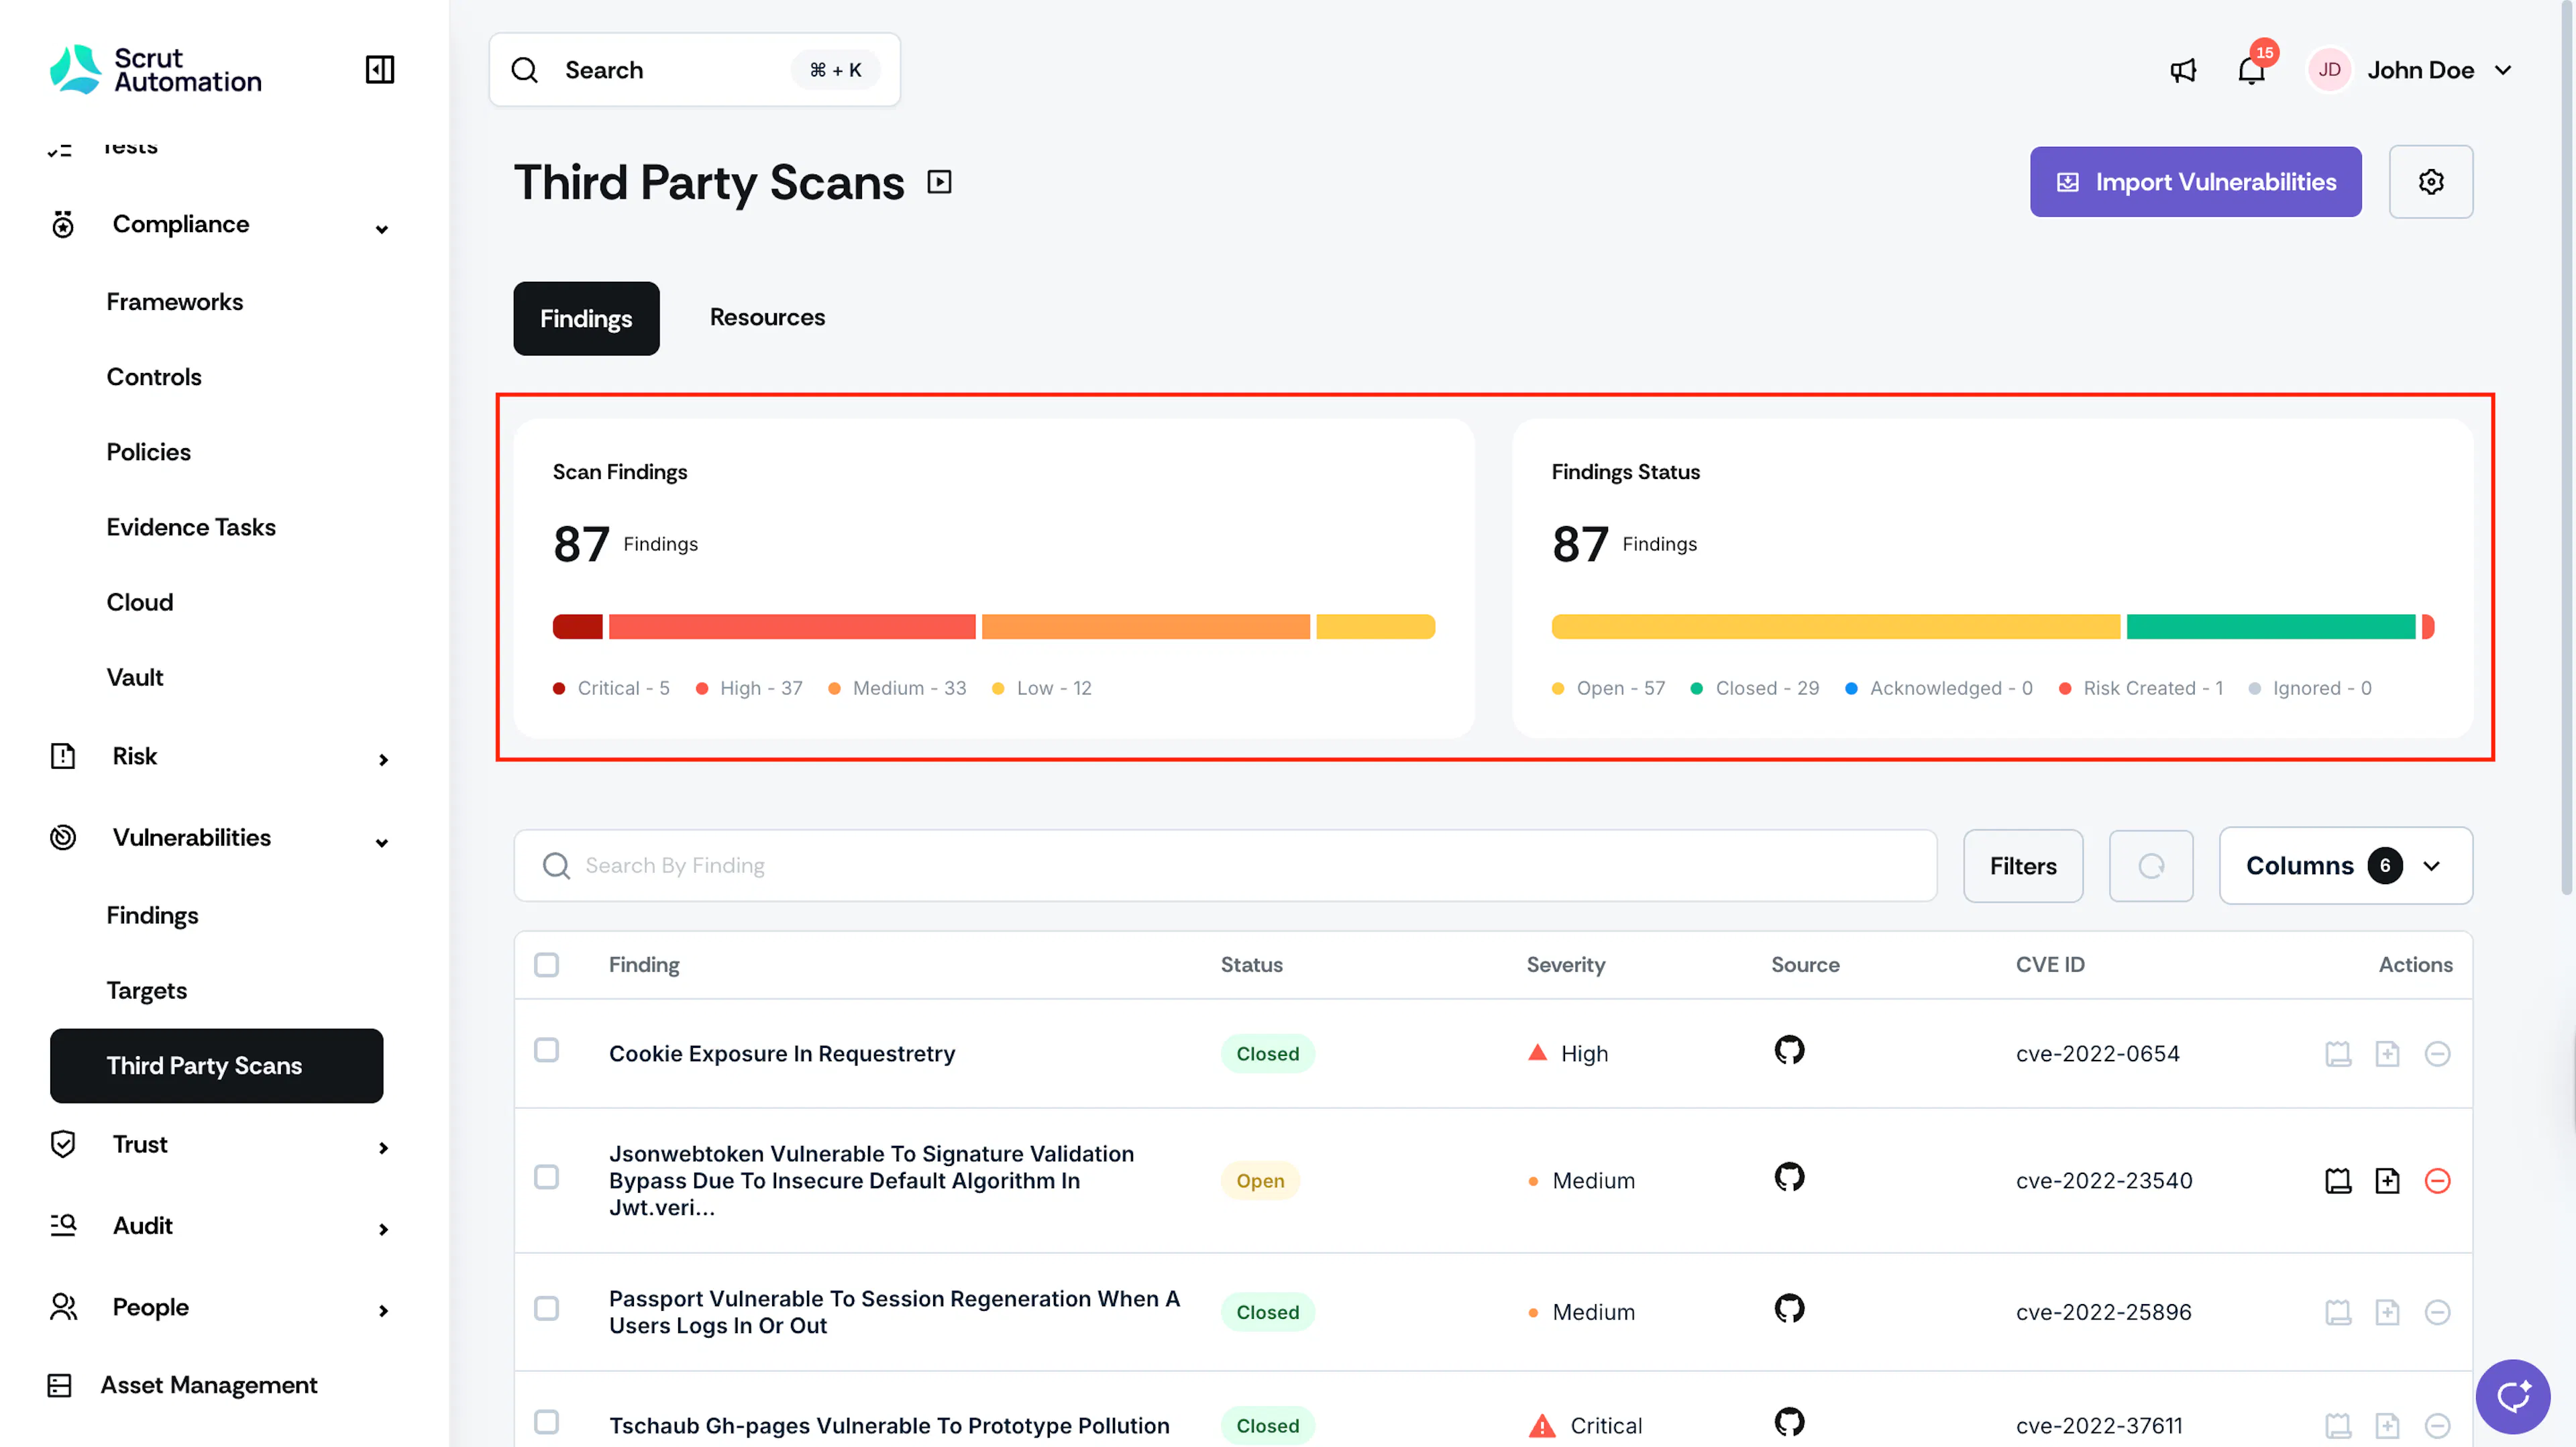
When you open Vulnerabilities → Third Party Scans, you land on the Findings tab. Two summary charts at the top give you an immediate read of your vulnerability posture before you go into the table.
- Scan Findings shows the total number of detected vulnerabilities broken down by severity: Critical, High, Medium, and Low.
- Findings Status shows how those vulnerabilities are distributed across five states:
- Open: Default status for newly detected vulnerabilities
- Closed: Vulnerability remediated or is no longer present
- Acknowledged: Marked as noted and acknowledged
- Ignored: Marked as not requiring action
- Risk Created: Added as a risk to the Risk Register
Pro Tip!
The charts are interactive. Click any severity or status segment to instantly filter the findings table to that selection.
Zero in on a Finding
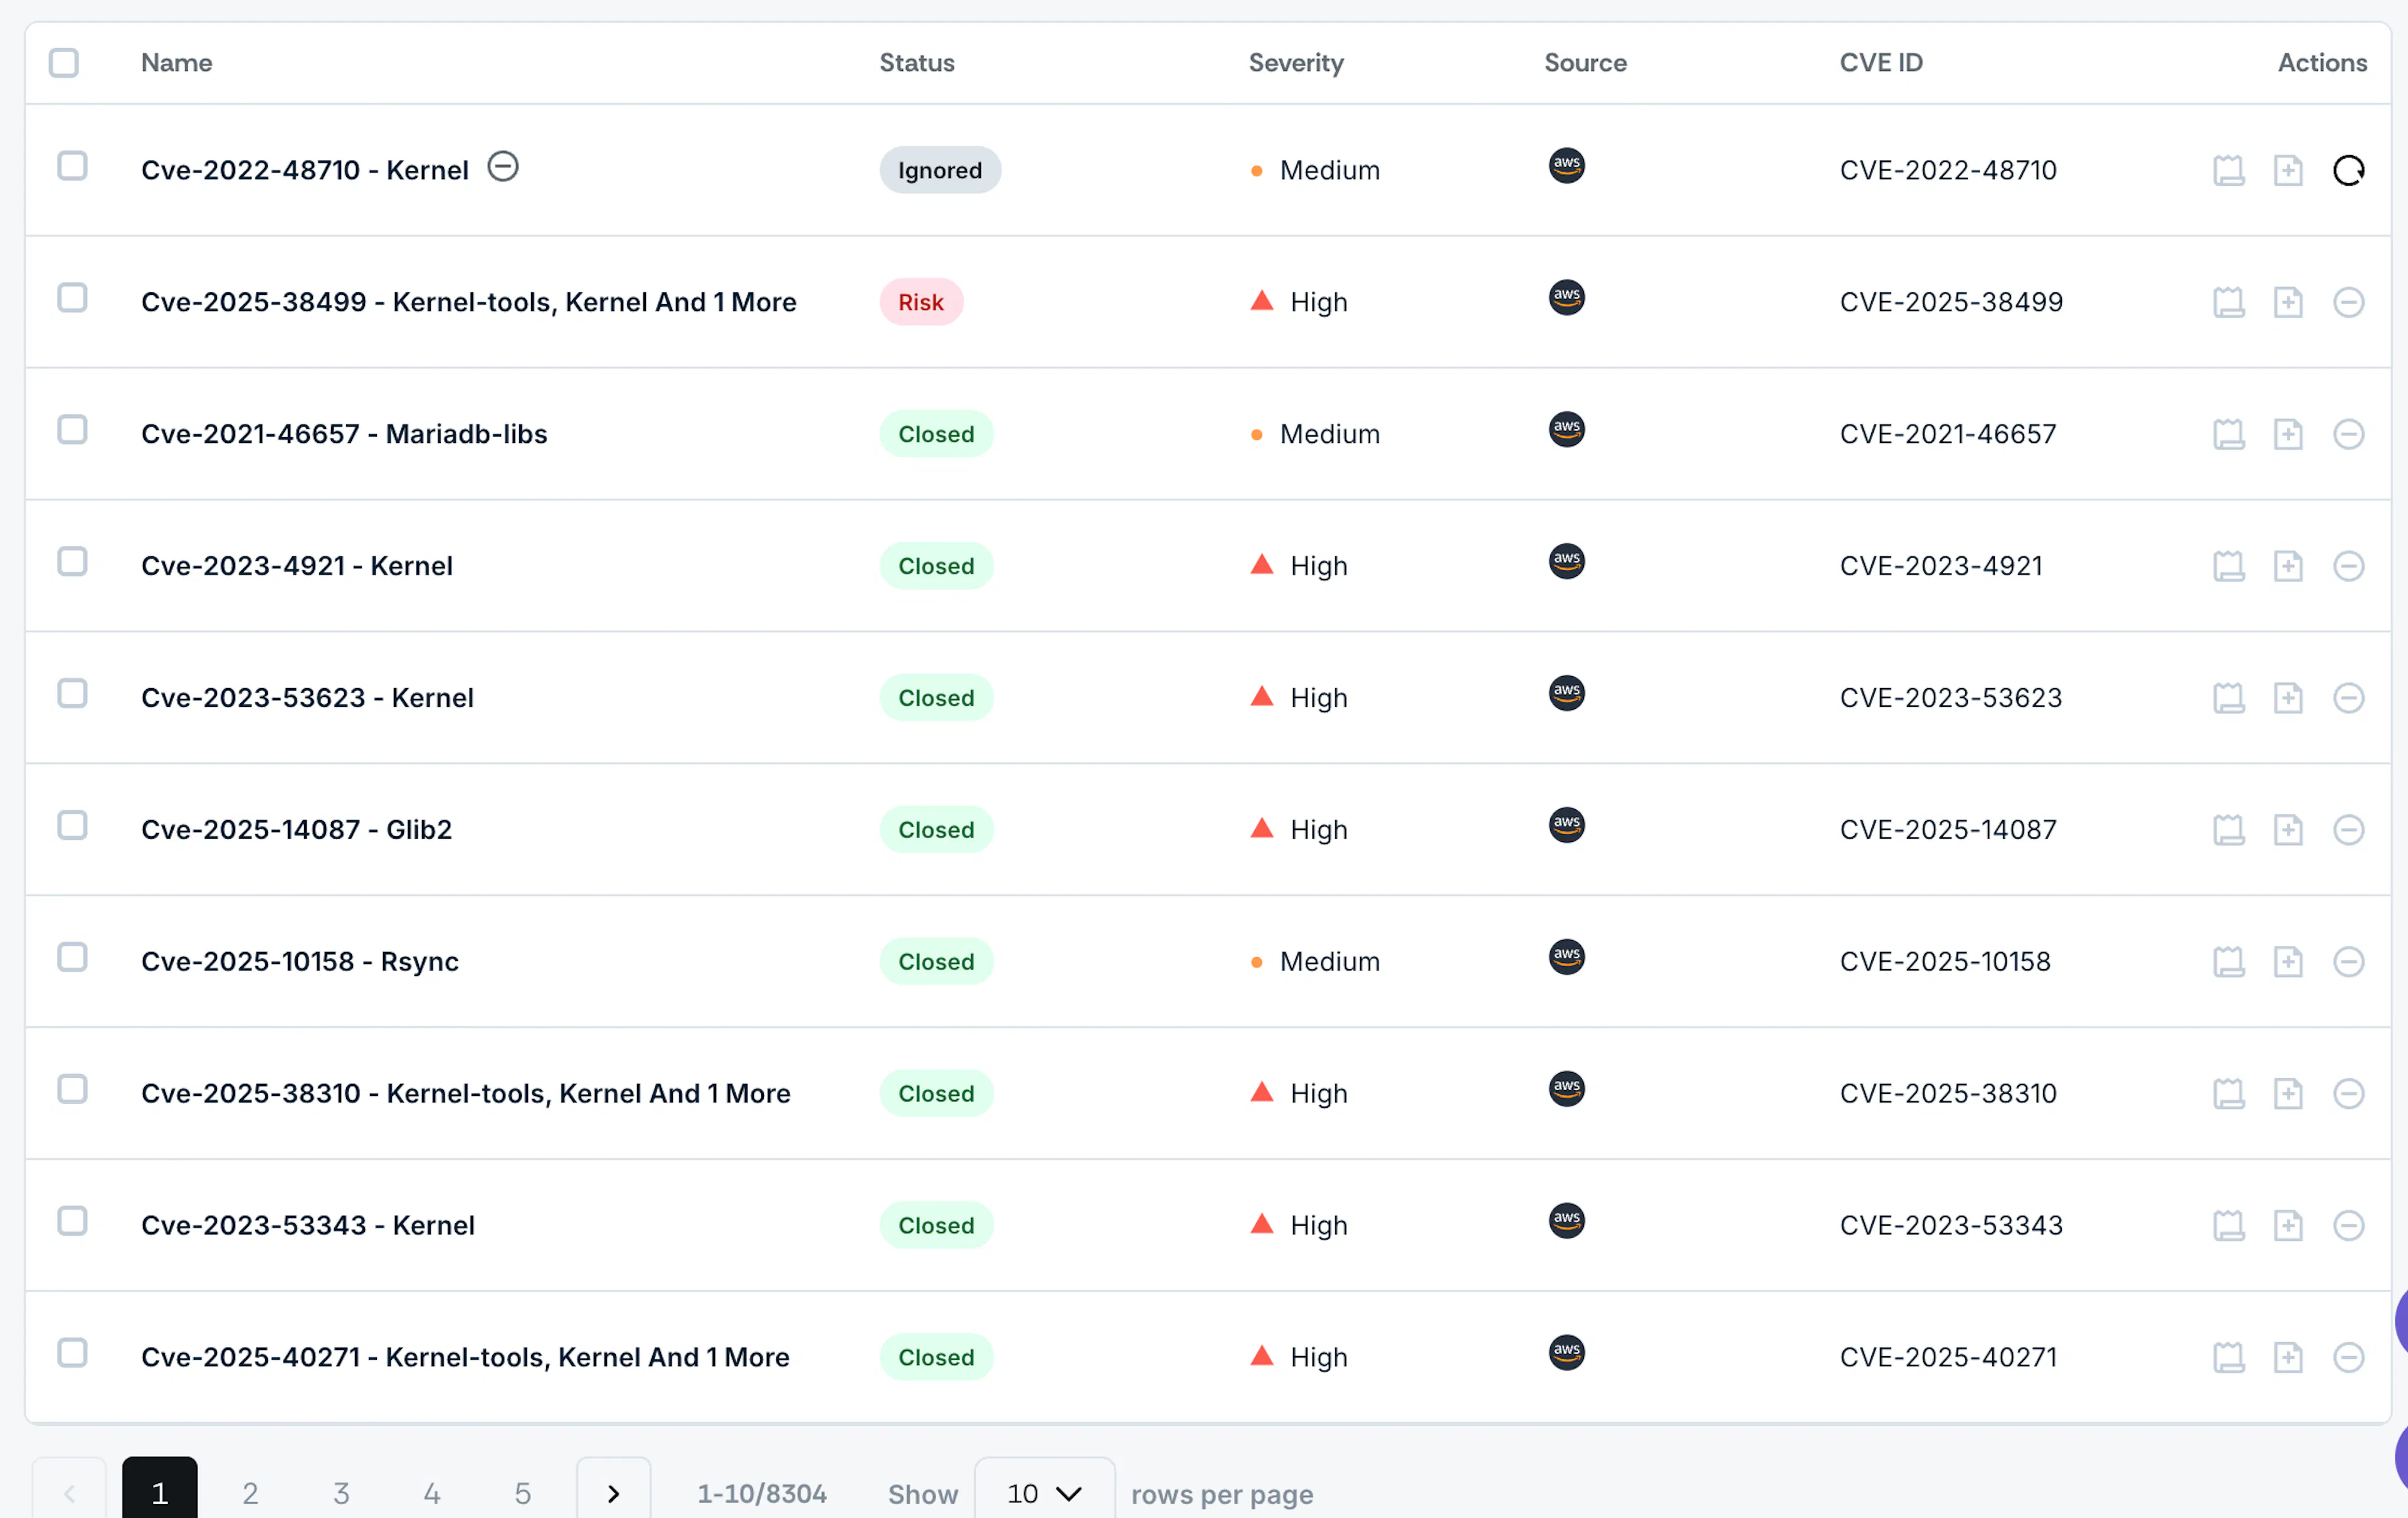
The findings table lists every vulnerability synced from your connected tools. Each row shows the:
- Vulnerability Name: The specific name/title of each vulnerability
- Status: Current state of the vulnerability
- Severity: Indicates the criticality level of the vulnerability (Critical, High, Medium, Low)
- Source: Identifies which integration/tool detected the vulnerability
- Fix Available: Shows whether a fix or mitigation is available for the vulnerability
- CVE ID: Common Vulnerabilities and Exposures identifier when available
- Owner: The user responsible for managing the vulnerability
- First Seen: Date when the vulnerability was first detected
- Number of Assets: Indicates the number of assets affected by the vulnerability
- SLA: Shows the SLA status for vulnerability remediation
To narrow your view:
- Use the search bar to look up a specific vulnerability by name.
- Click Filters to refine results by severity, fix availability, or source.
- Click Columns to add or remove table columns. Your selection applies immediately.
Take Action on a Finding
Use the Actions column to triage findings directly from the table. To act on multiple findings at once, select them using the checkboxes, then choose your action.
Create a Jira Ticket
Track a finding through remediation by connecting it to your Jira workflow.
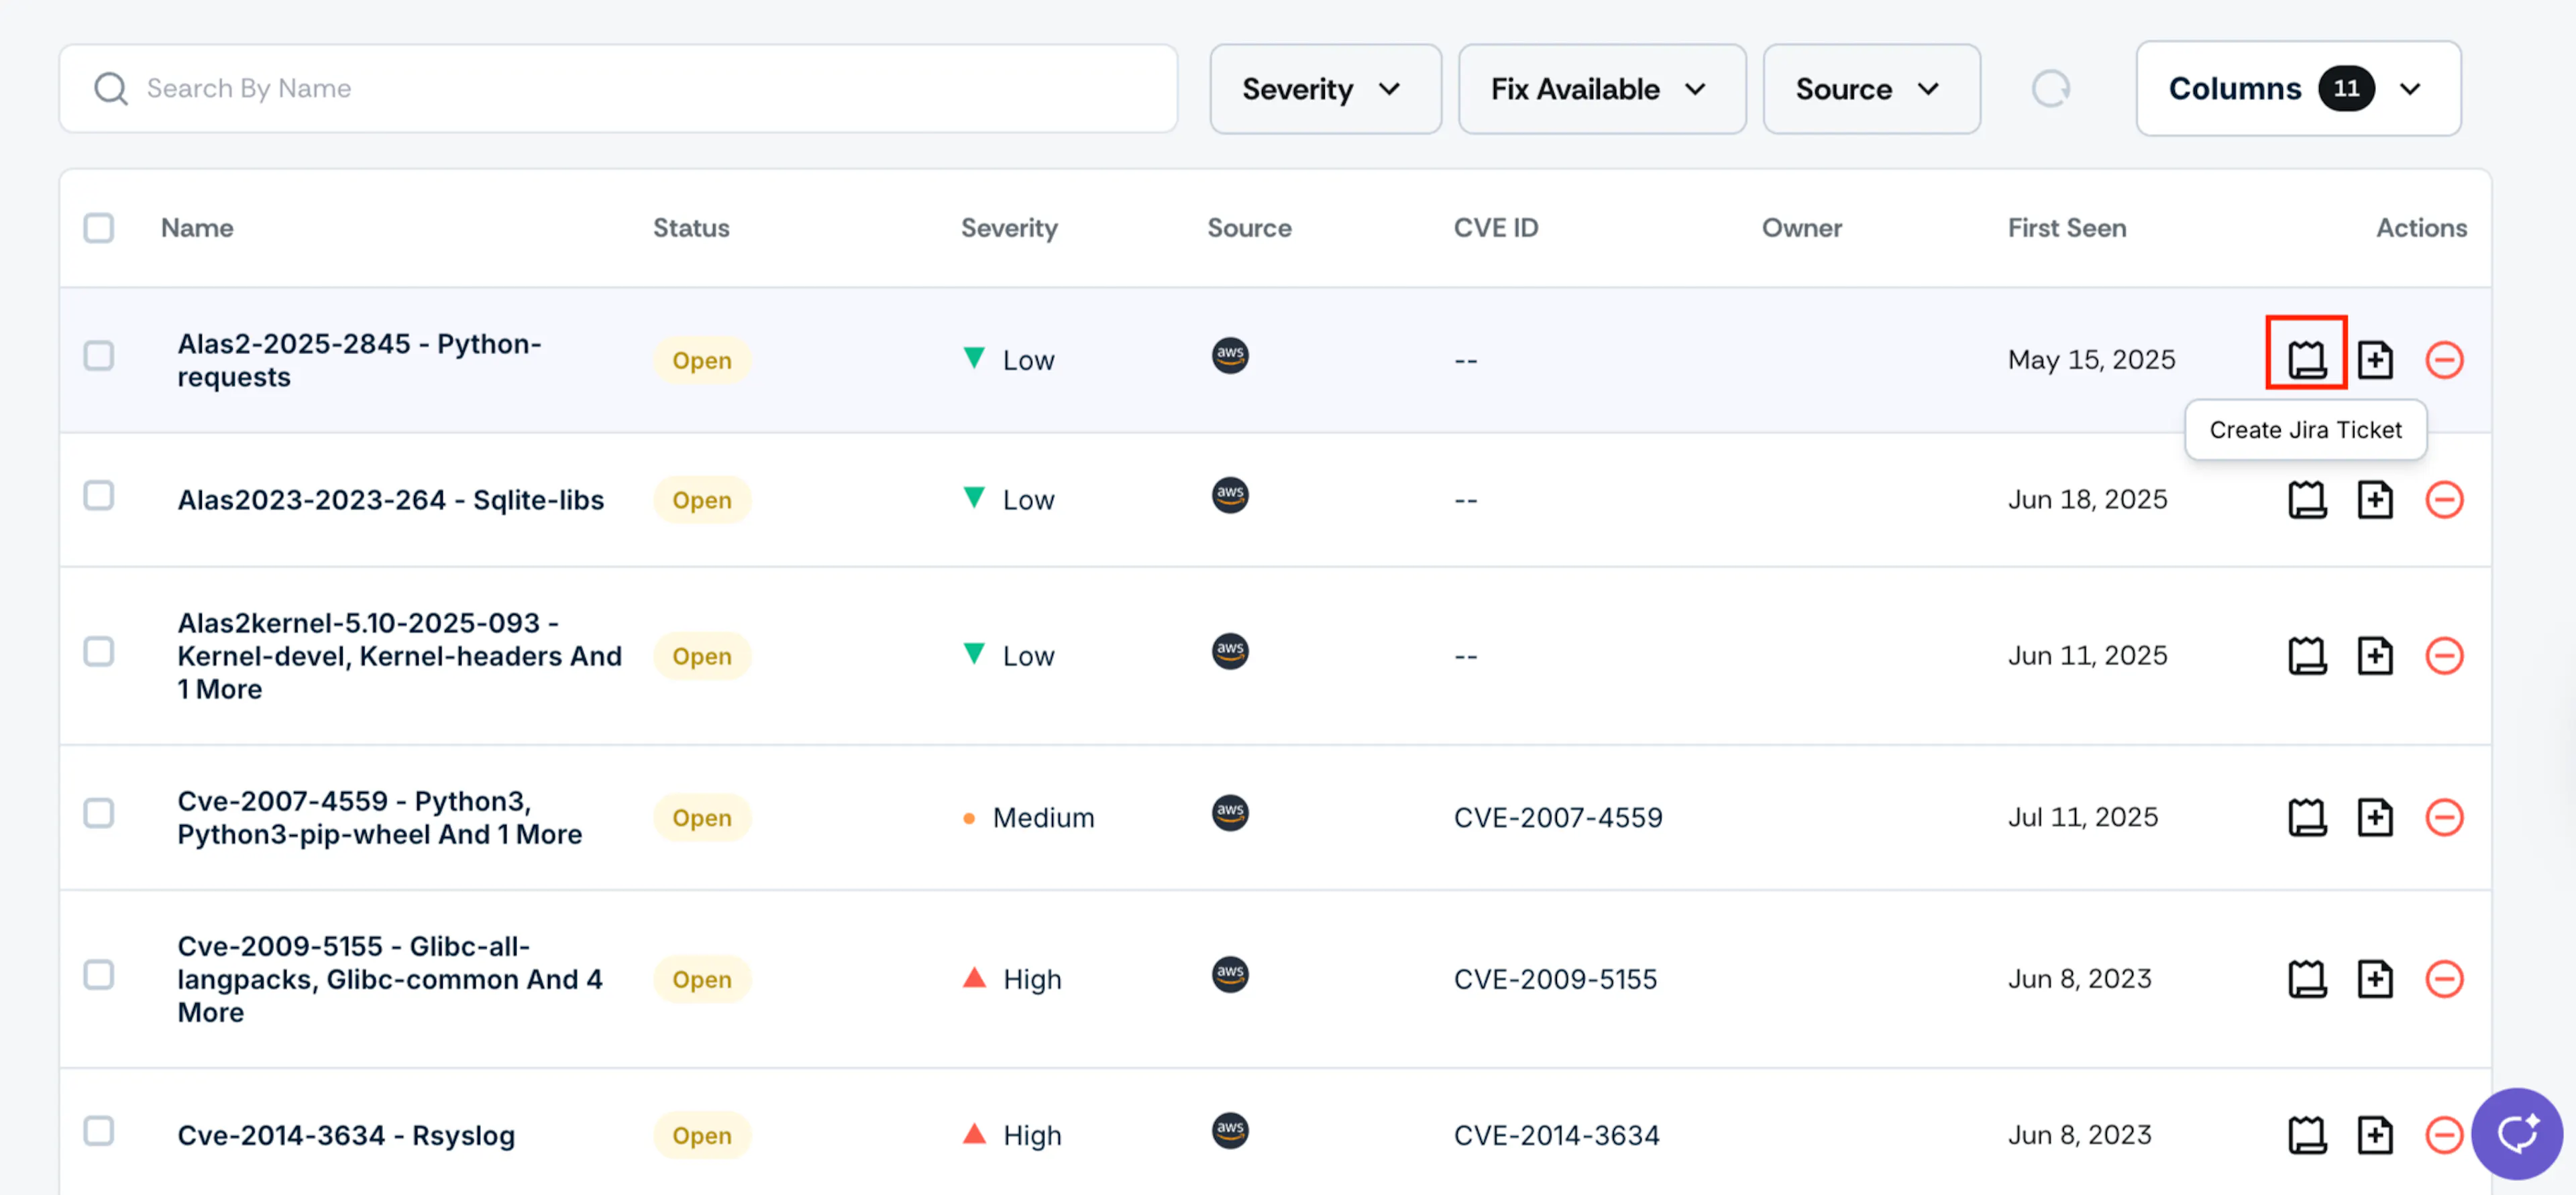
- Click the Create Jira Ticket icon next to the finding.
- Enter the ticket details and click Create.
Scrut creates the ticket in Jira and assigns it to the selected assignee. Ticket status syncs back to Scrut automatically. To view all linked tickets for a finding, open its detail page and go to the Tickets tab.
Note: Select multiple findings to create Jira tickets in bulk.
You can generate tracking tickets in your connected Jira account for vulnerability remediation. This helps integrate vulnerability management into your existing workflow. Click the Create Jira Ticket icon next to the vulnerability you want to add a tracking ticket to.
Add to the Risk Register
Escalate a finding with broader business impact by adding it as a risk to your Risk Register.
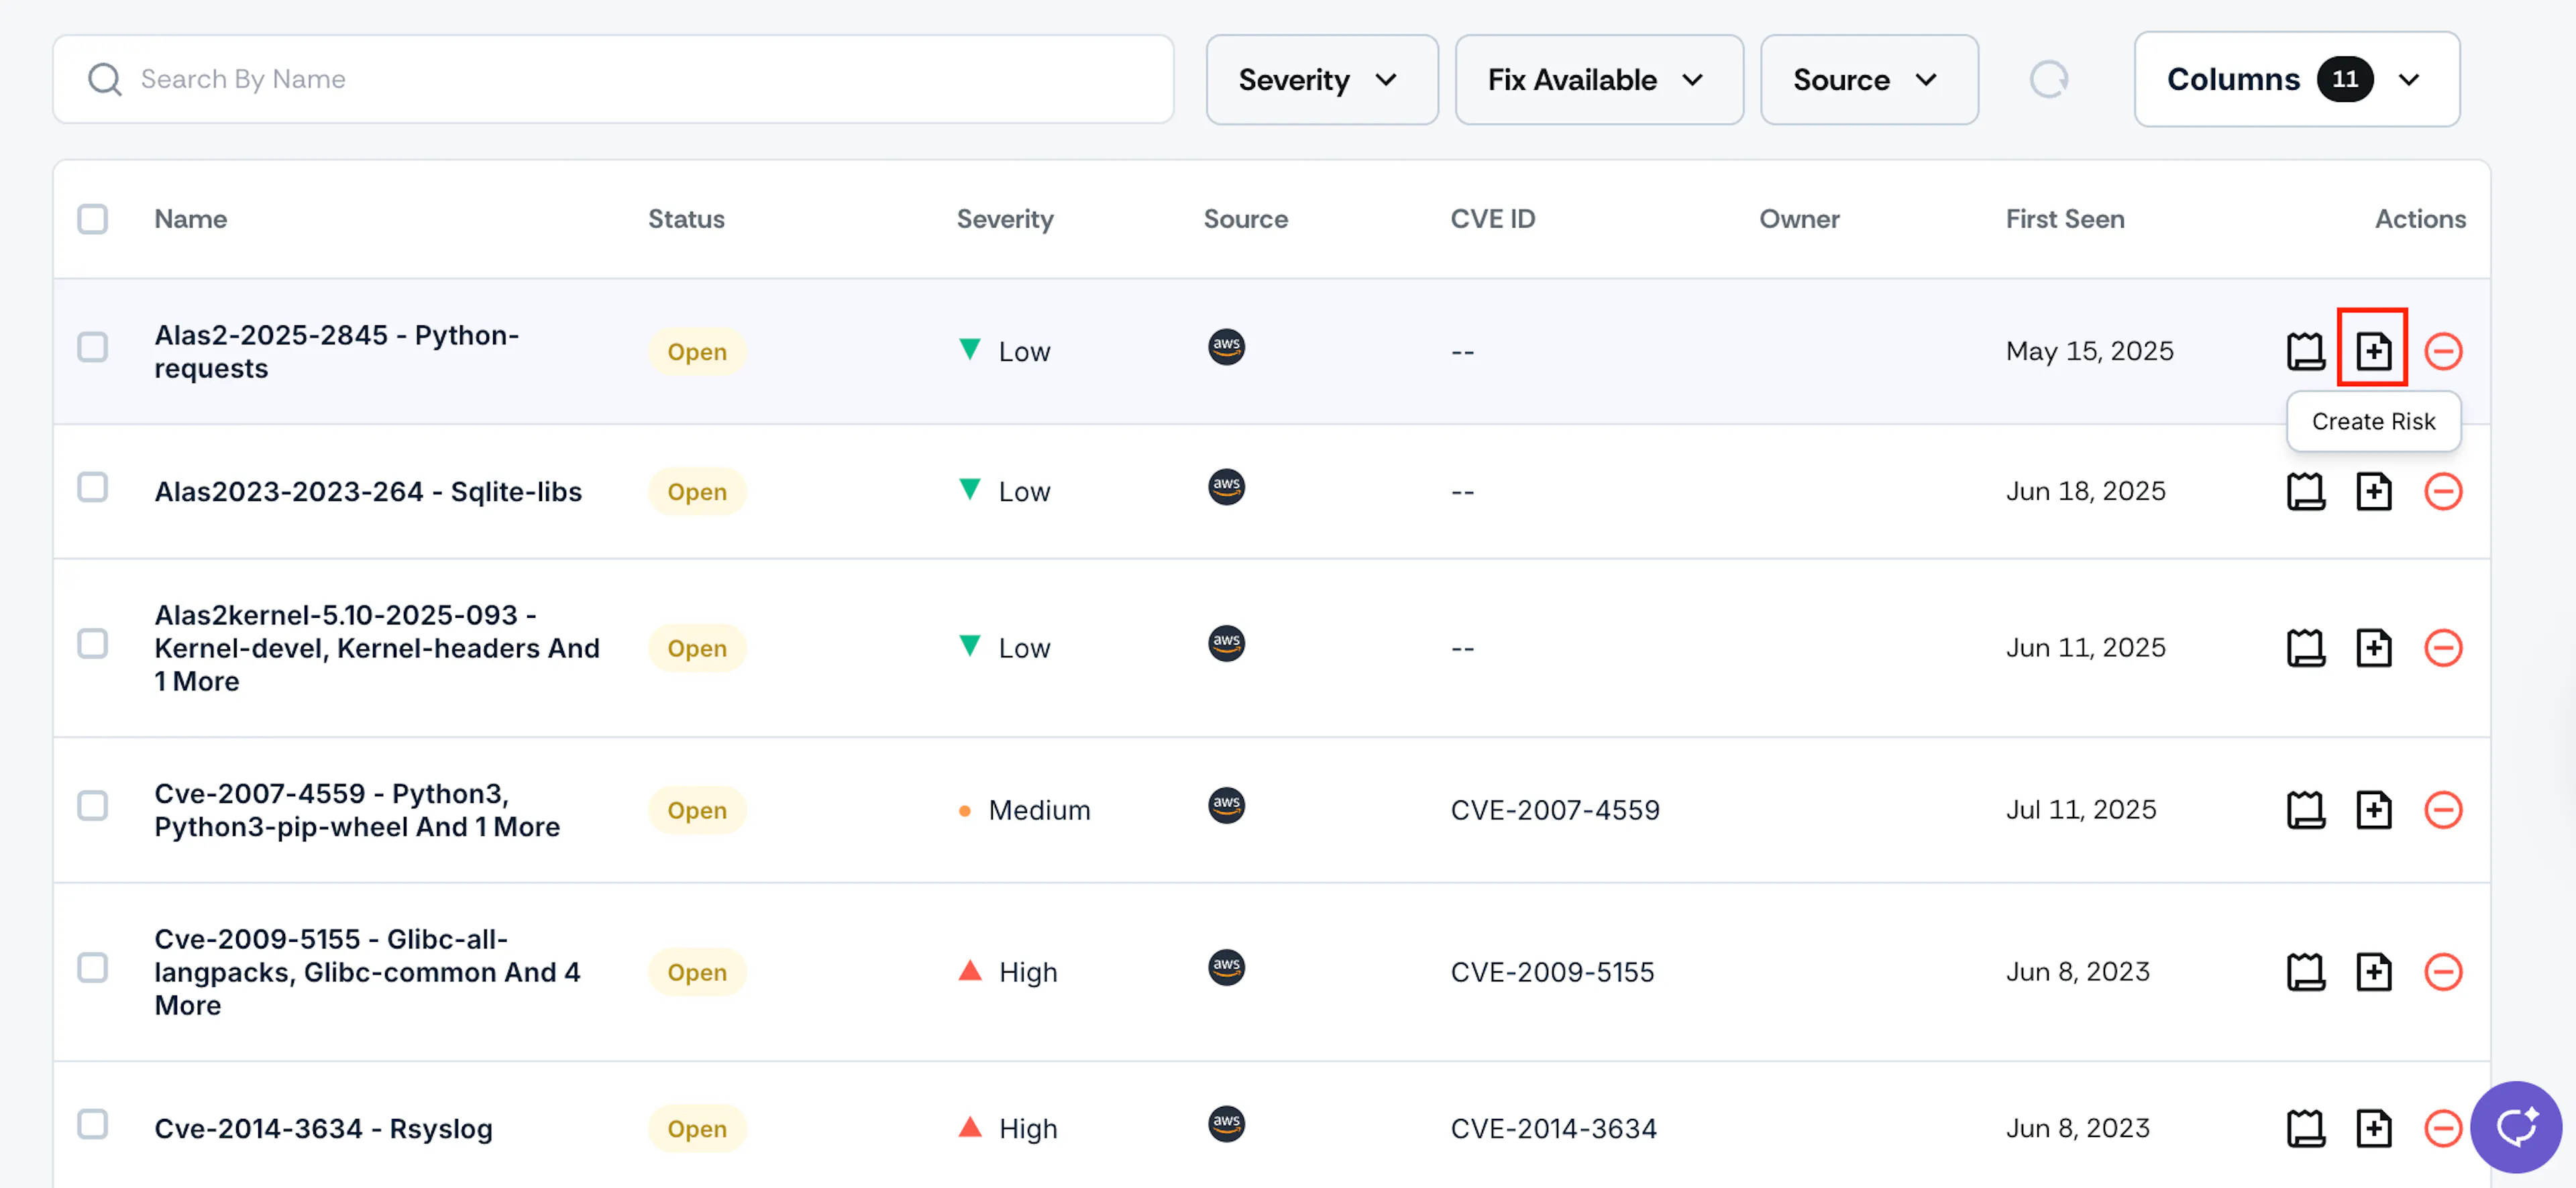
- Click the Create Risk icon next to the finding.
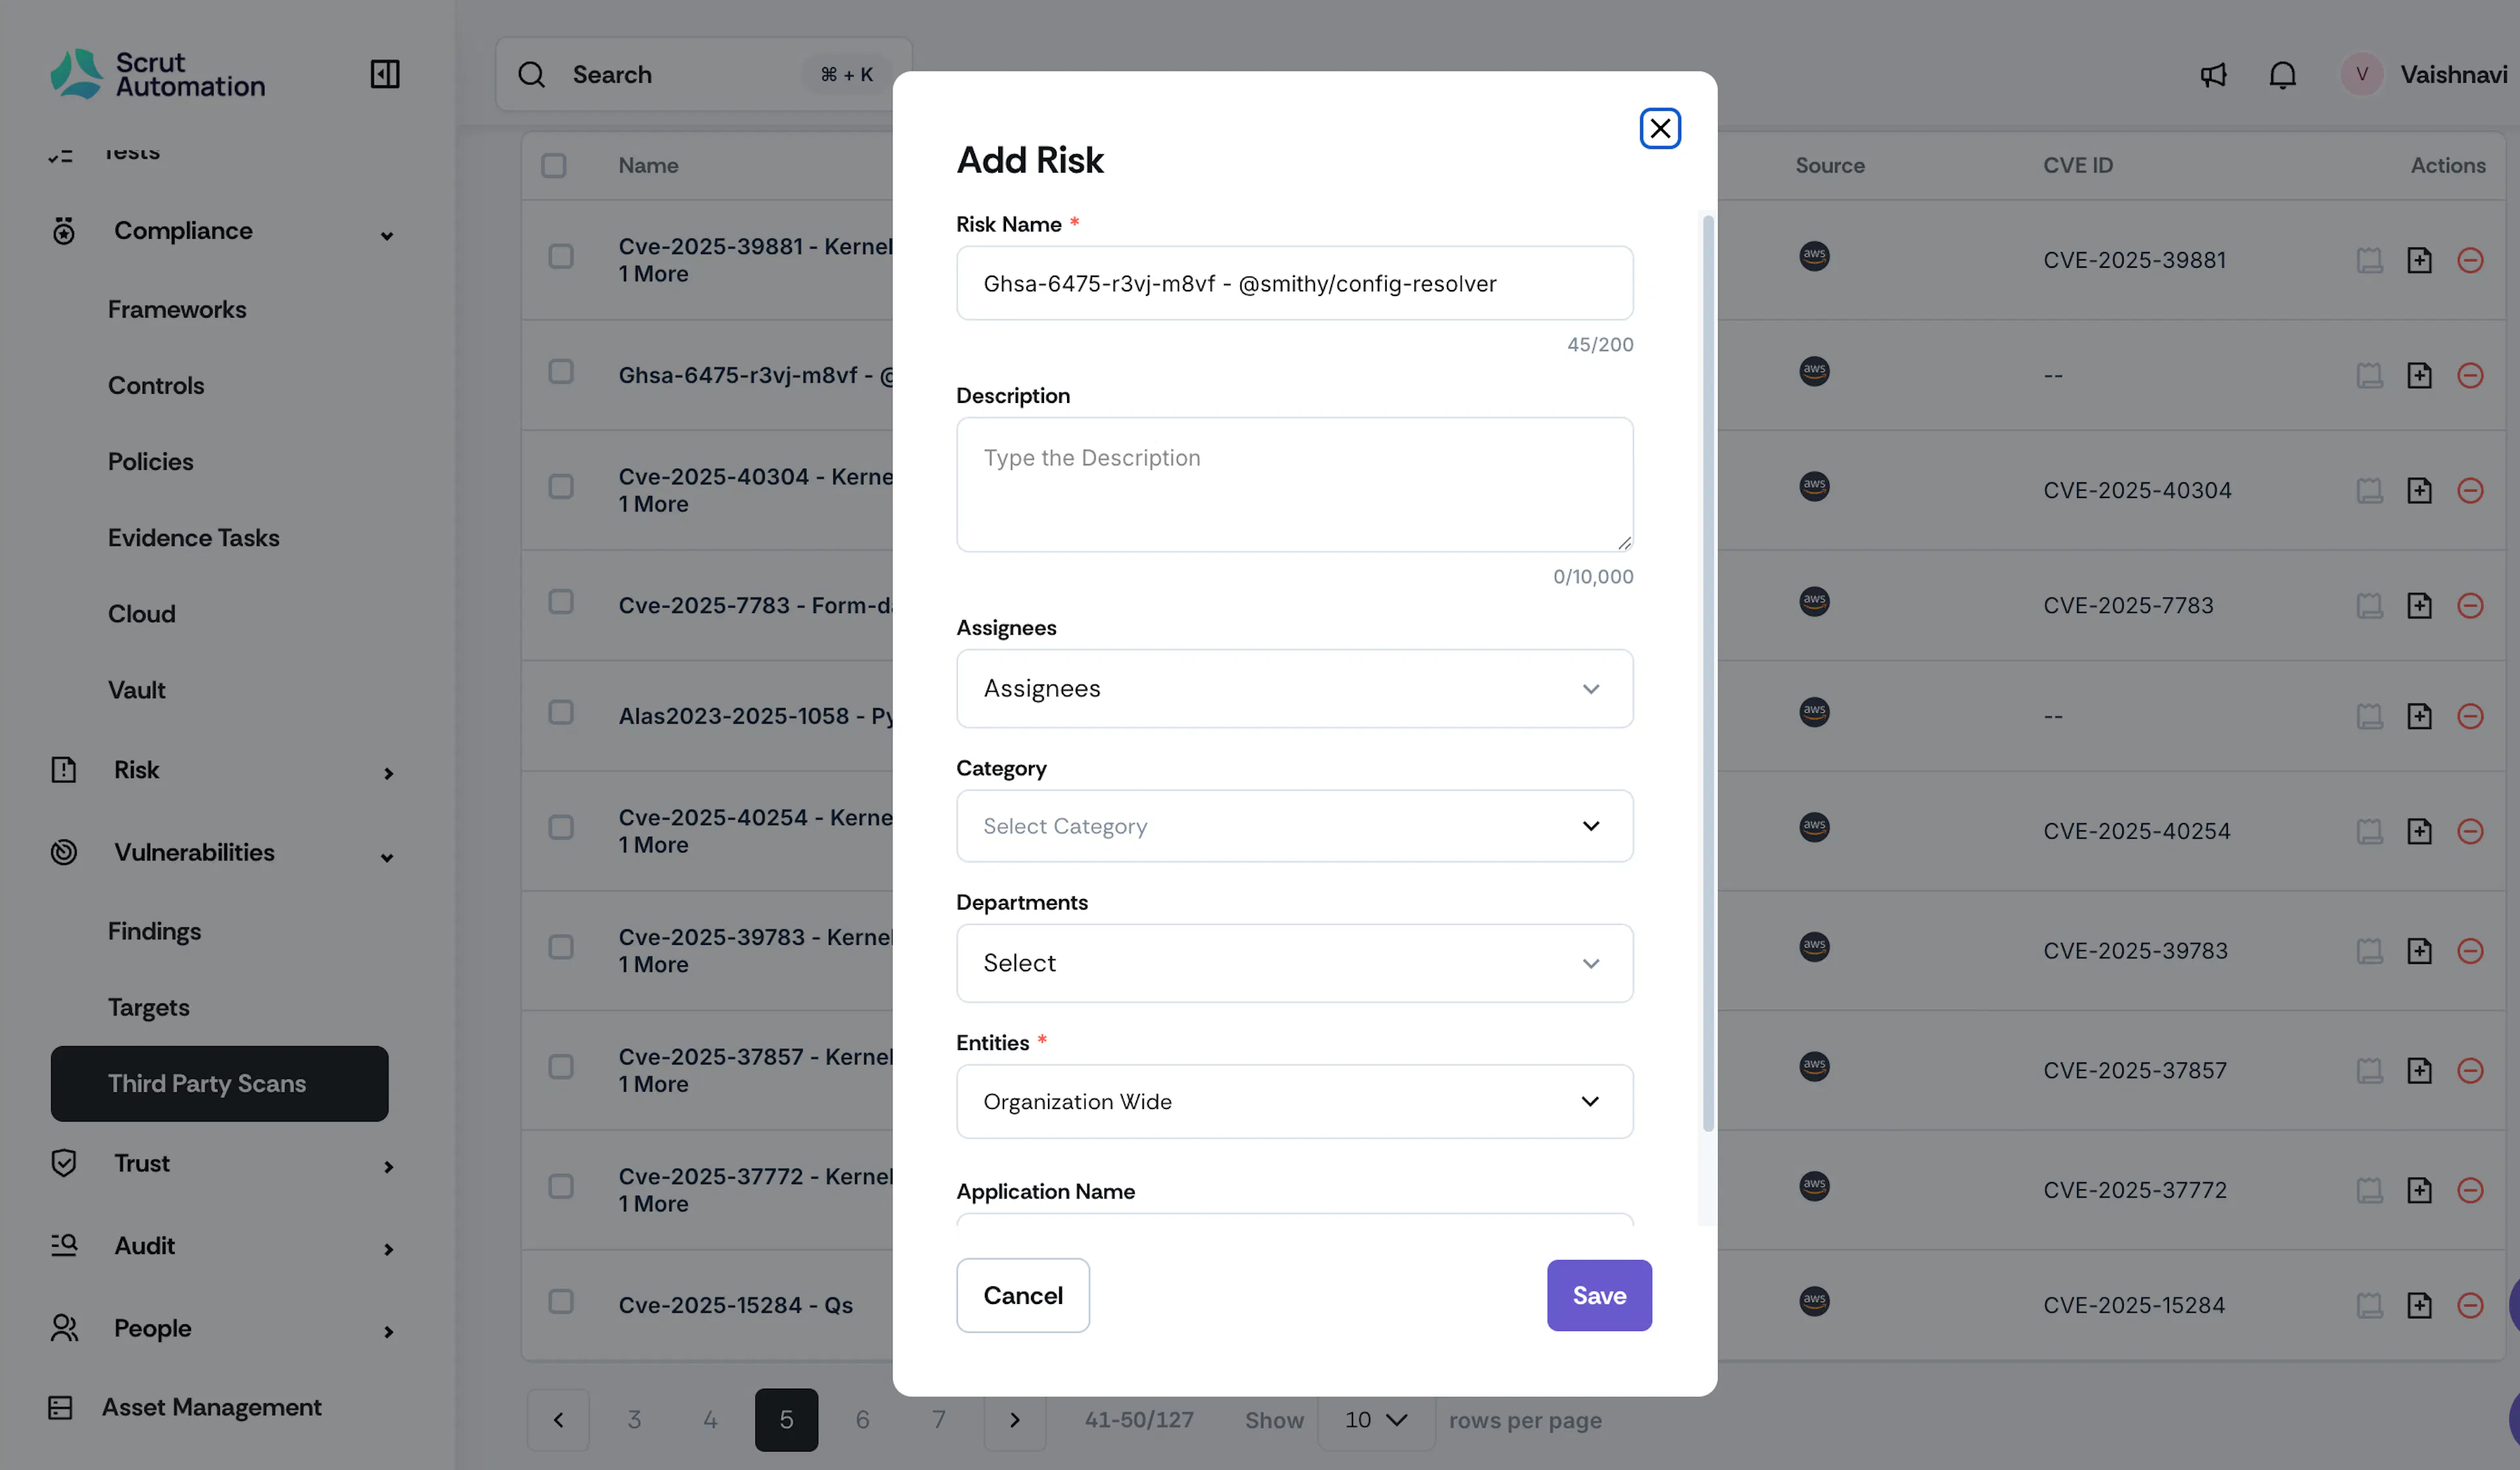
- Review the auto-filled risk name and description. Edit if needed.
- Set the assignees, risk category, department, and entities.
- Enter the application name and select the affected assets.
- Click Save.
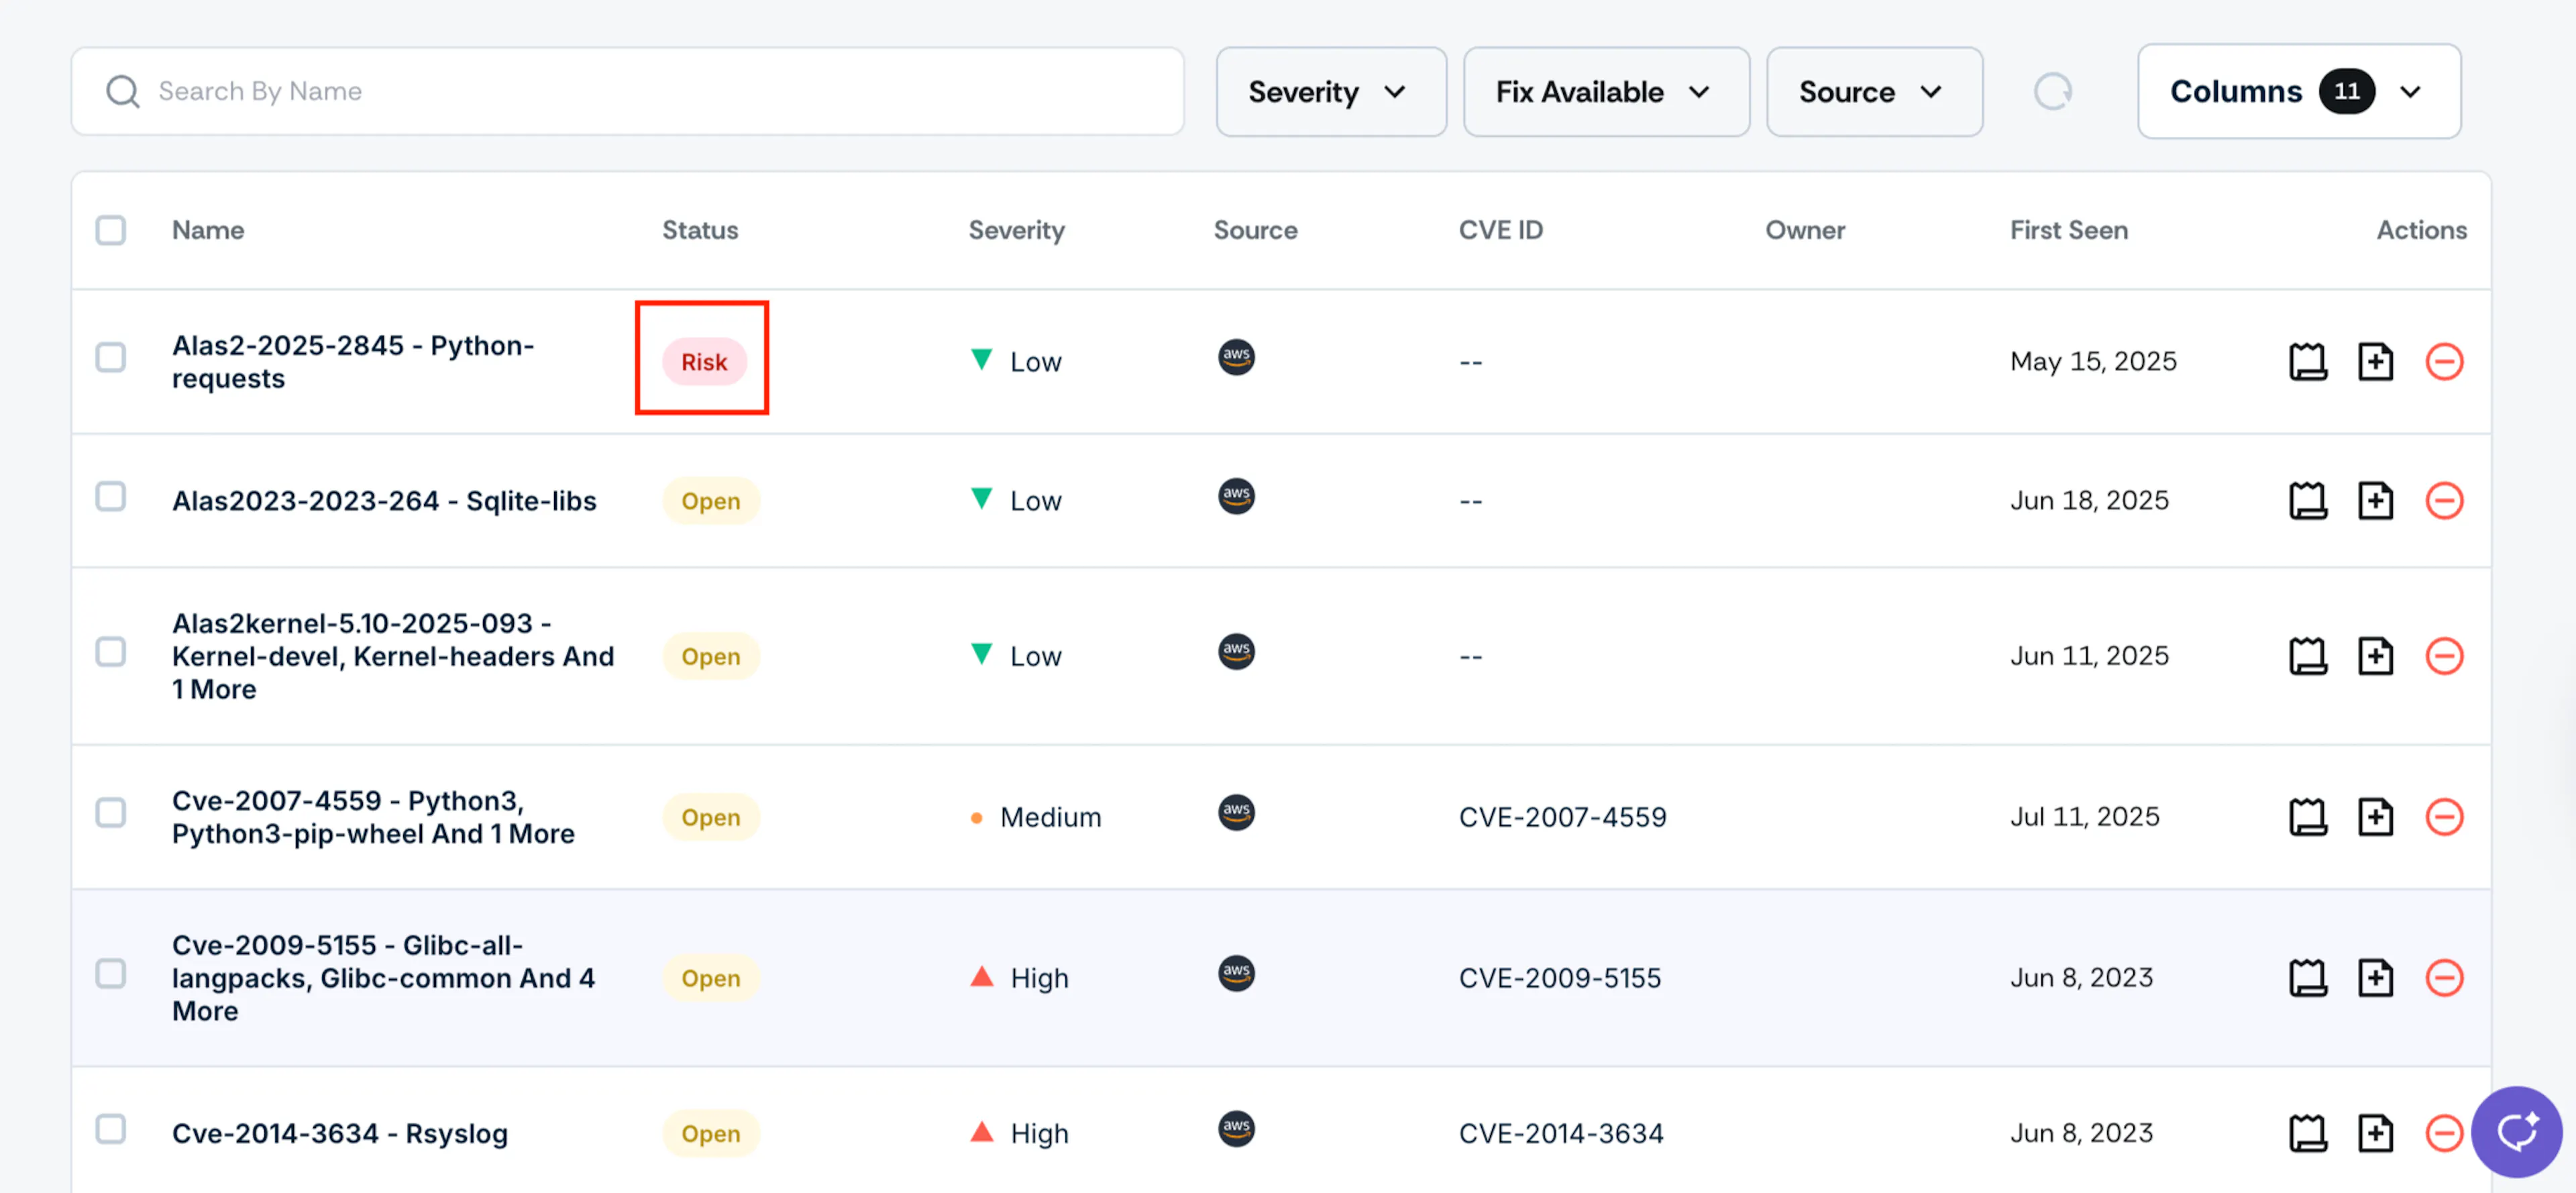
Scrut adds the risk directly into the risk register, and you can manage it from the Risk module. Once you create a risk, the vulnerability's status changes from Open to Risk Created.
Ignore a Finding
Mark false positives or accepted risks as ignored so they stop surfacing in future scans.
- Click the Ignore icon next to the finding.
- Click Ignore to confirm.
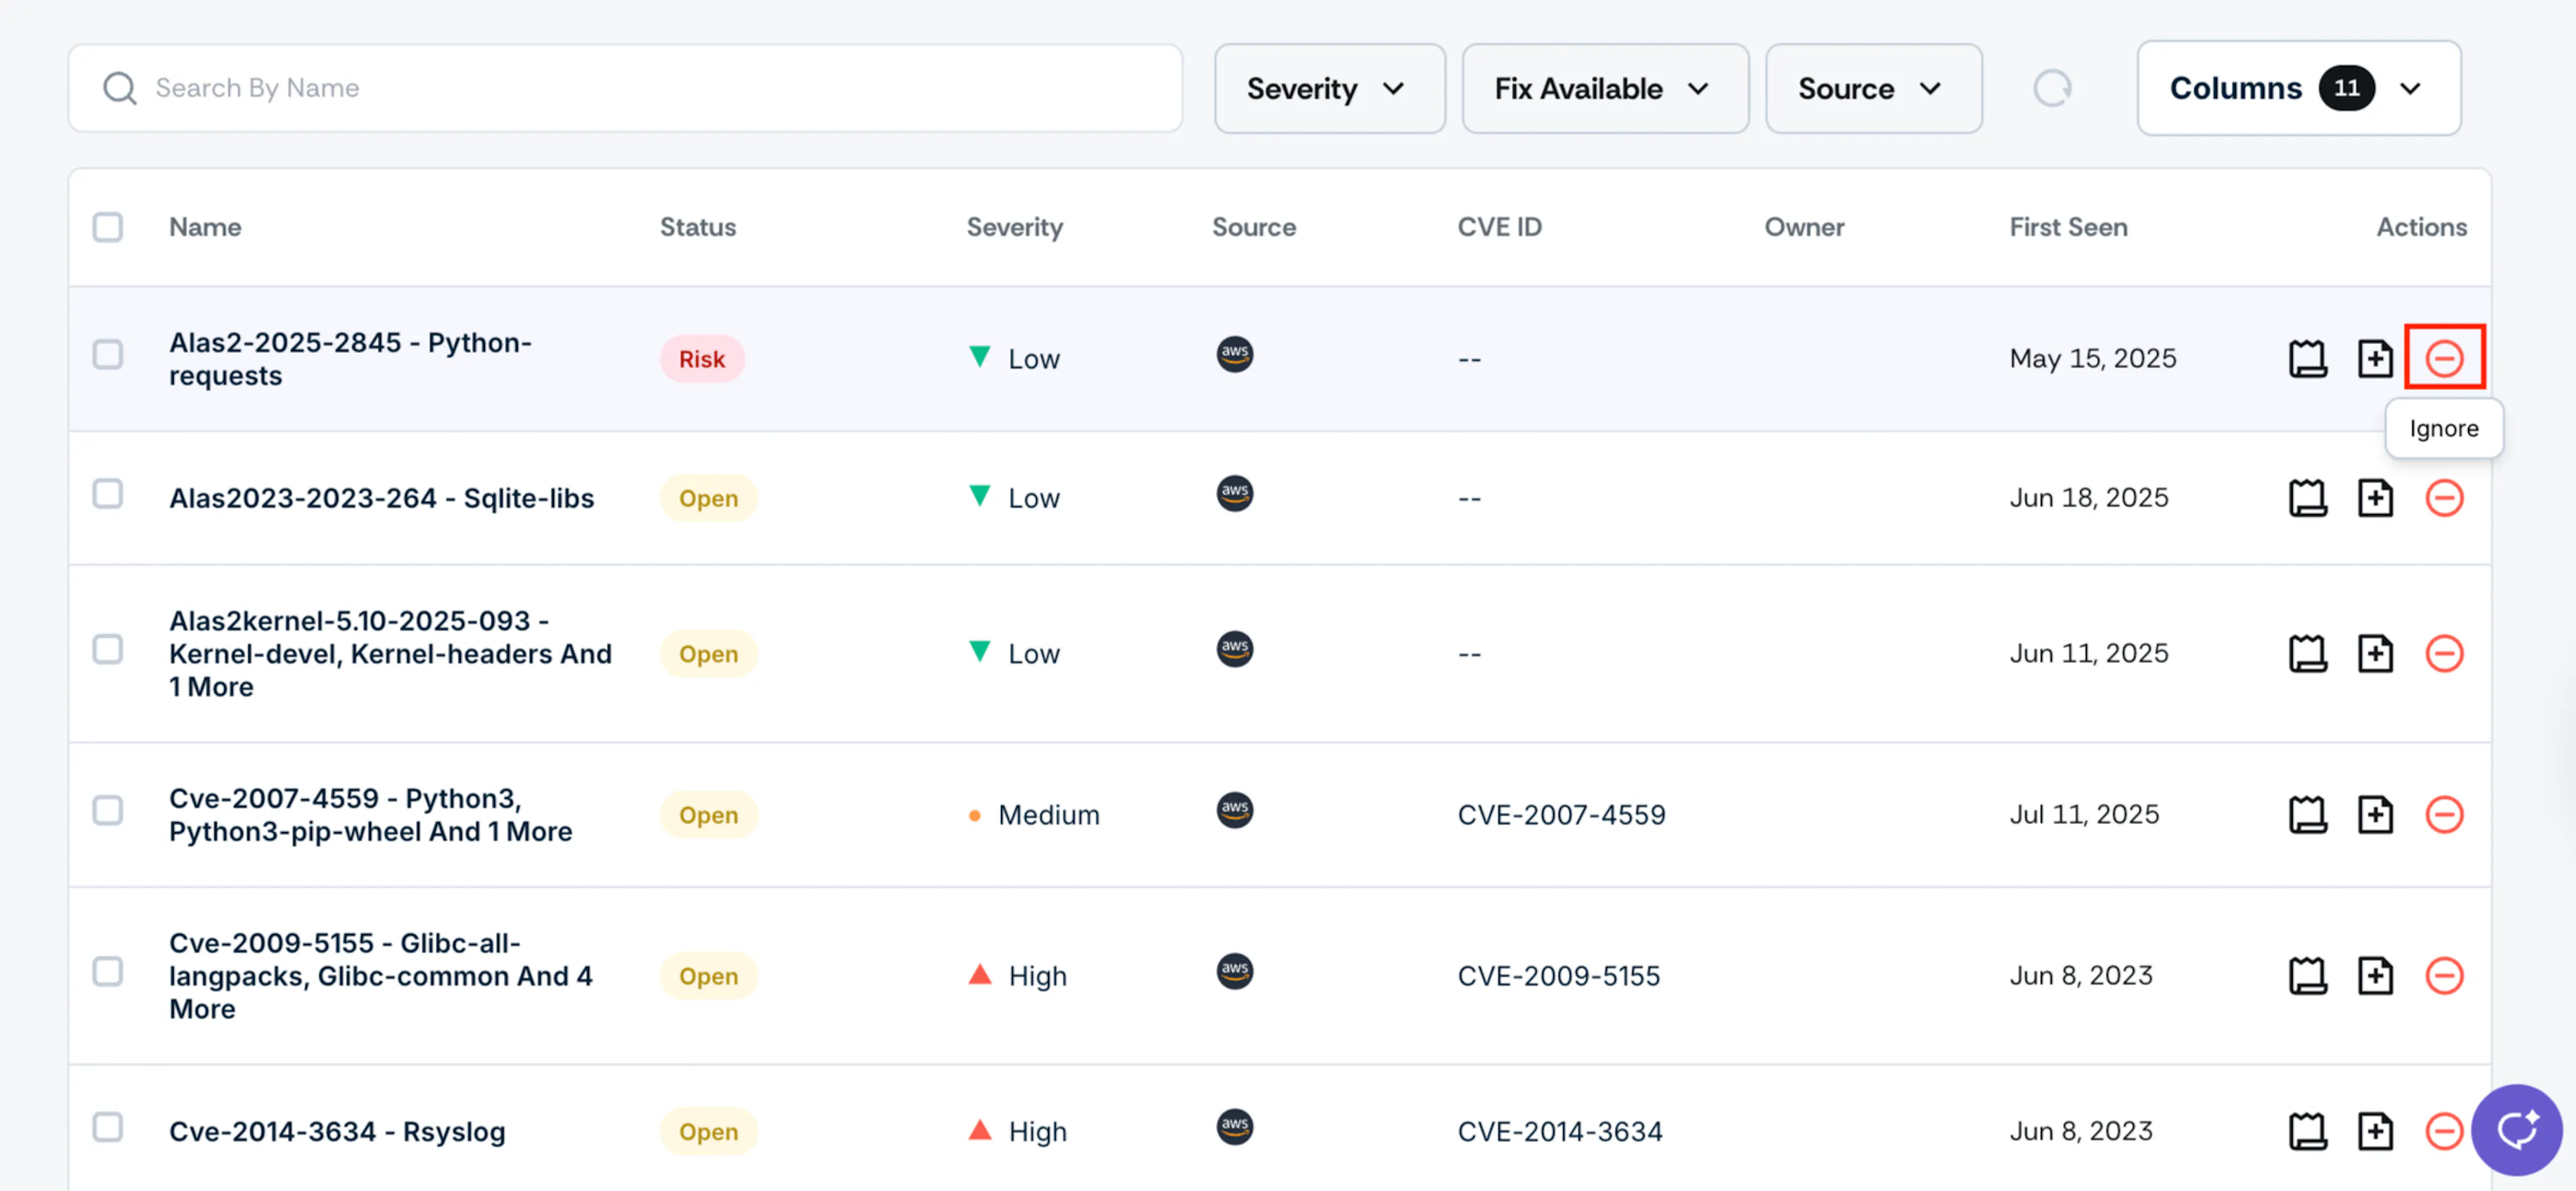
The status changes to Ignored.
Heads Up!
Once a finding is marked Ignored, Scrut will not surface it again in future scans of that target. Make sure the finding genuinely requires no further action before ignoring it.
Resources Tab
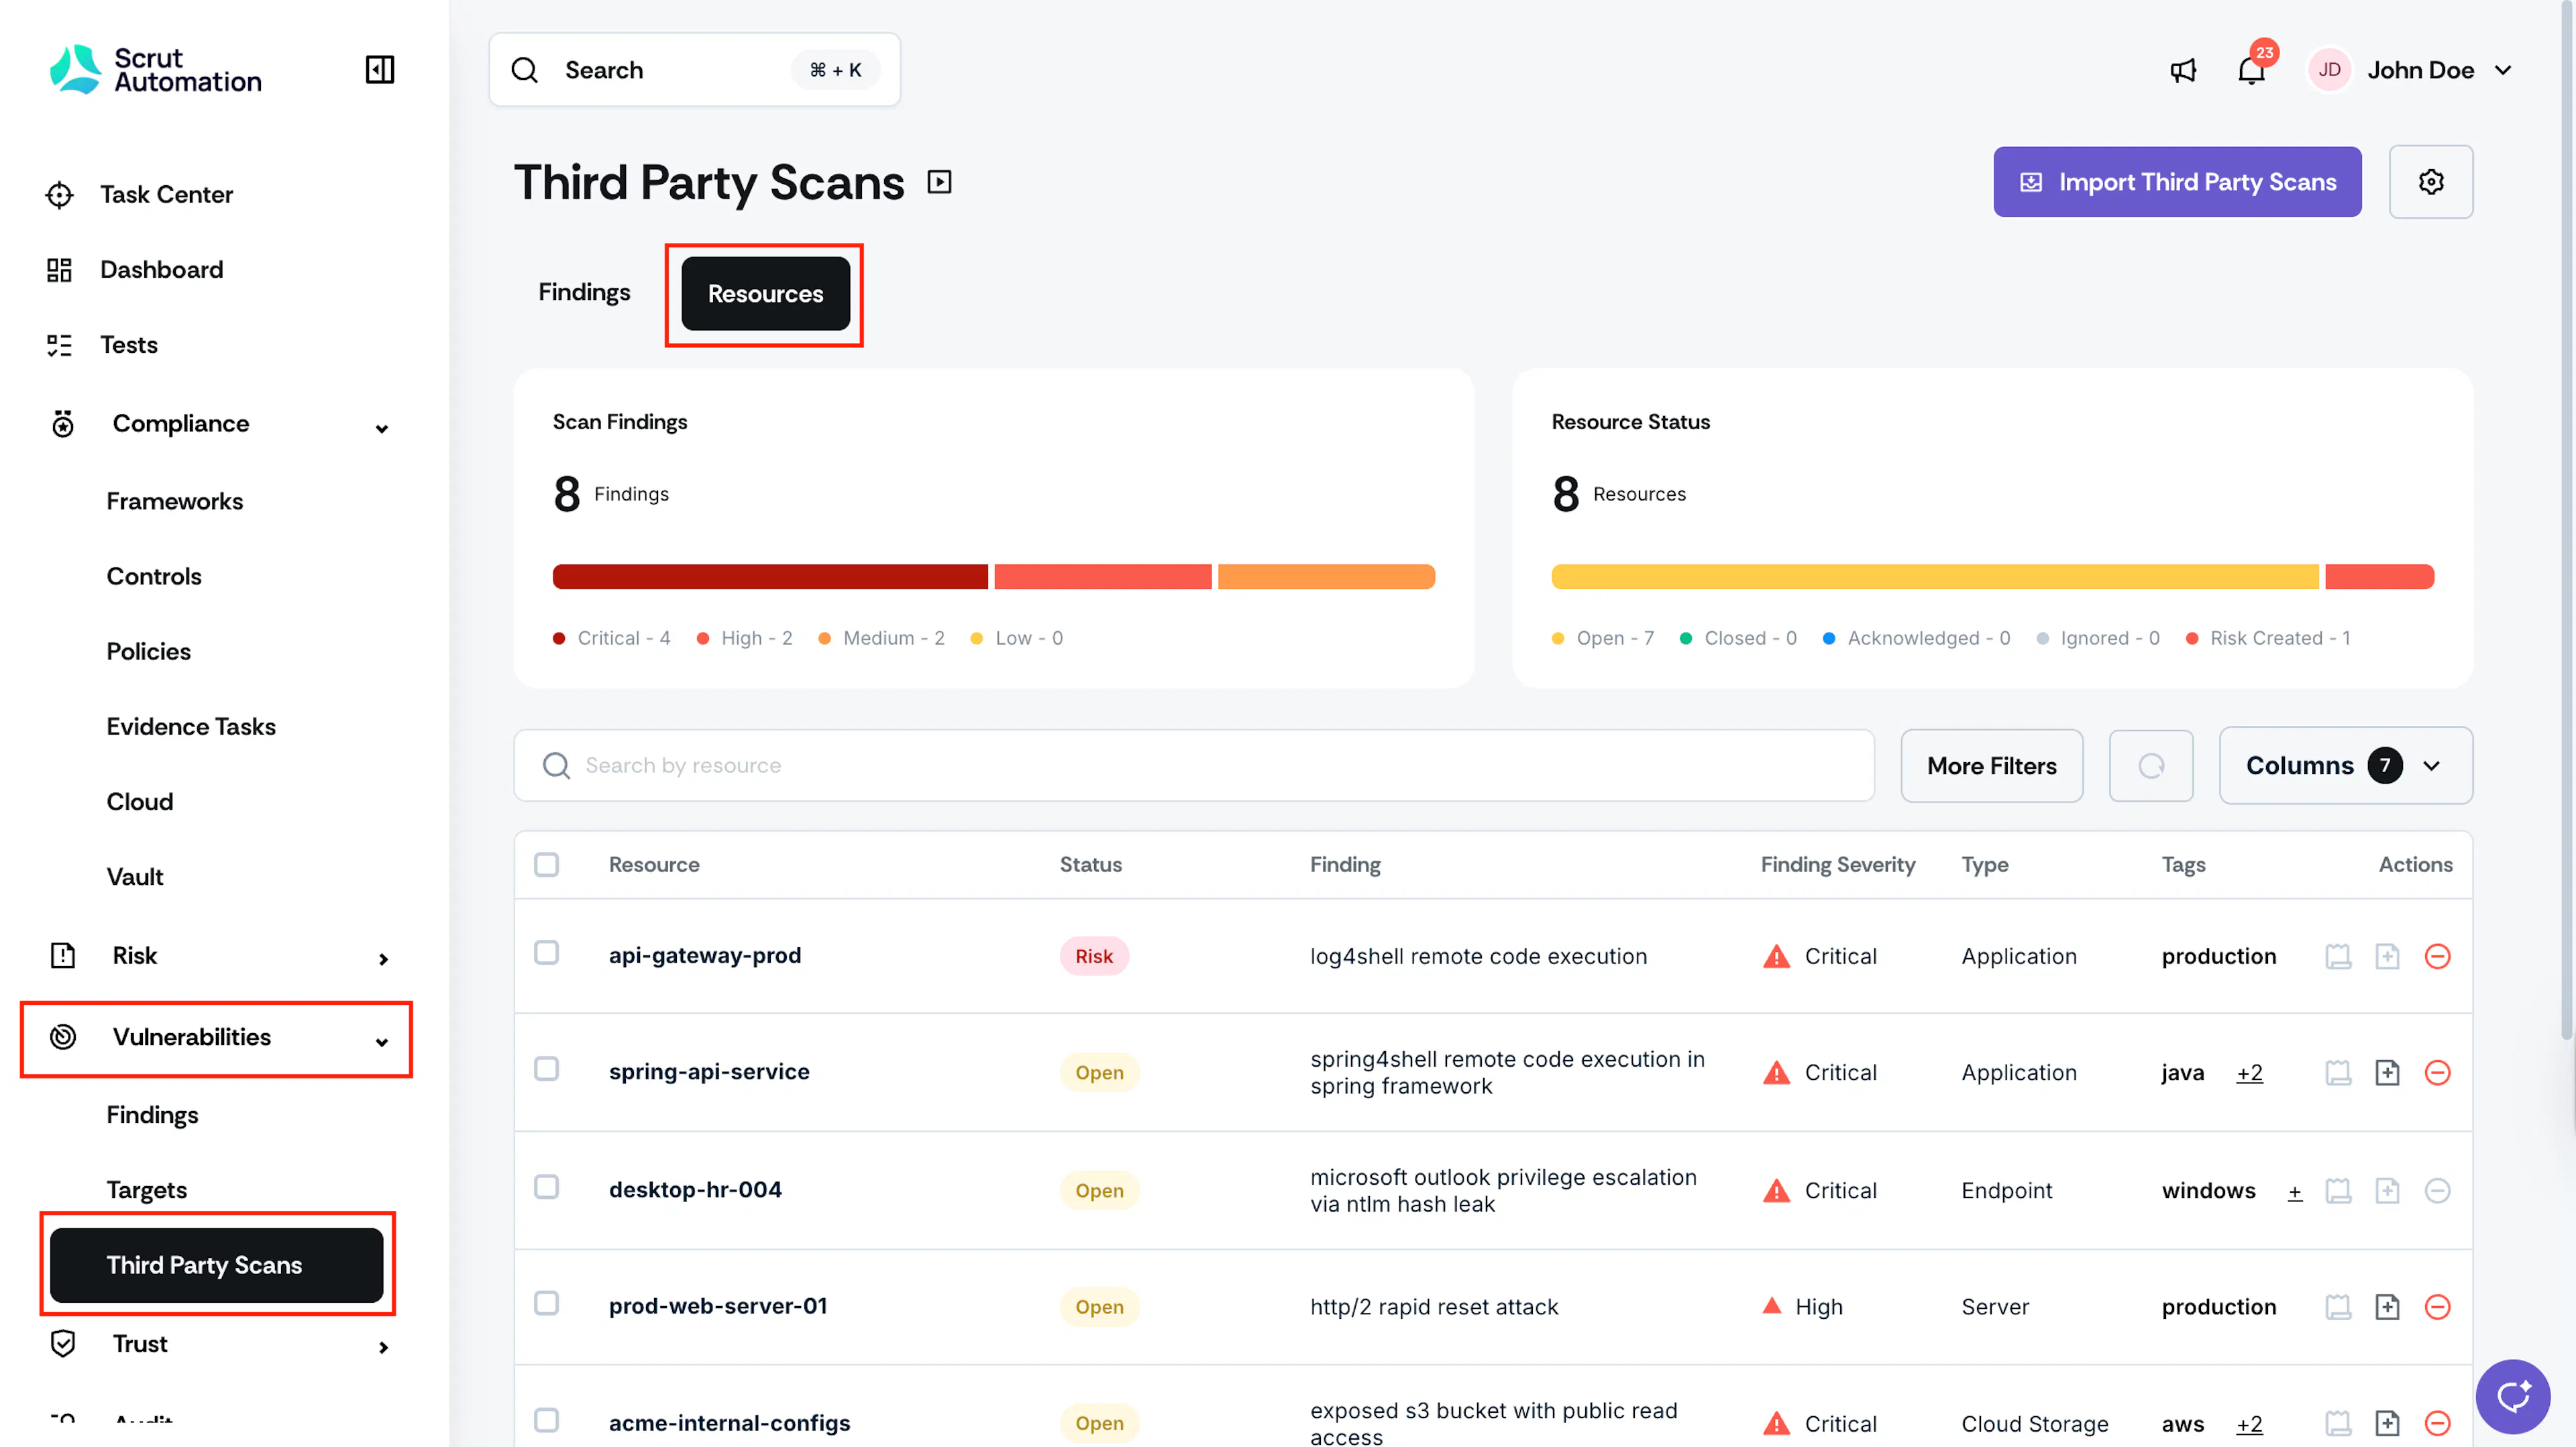
The Resources tab flips the view from individual vulnerabilities (CVEs) to the assets that carry them. Instead of clicking through findings one by one to identify impacted hosts or packages, you get a consolidated resource-first view that shows which assets are most exposed and which findings are attached to each.
Navigate to the Resources Tab
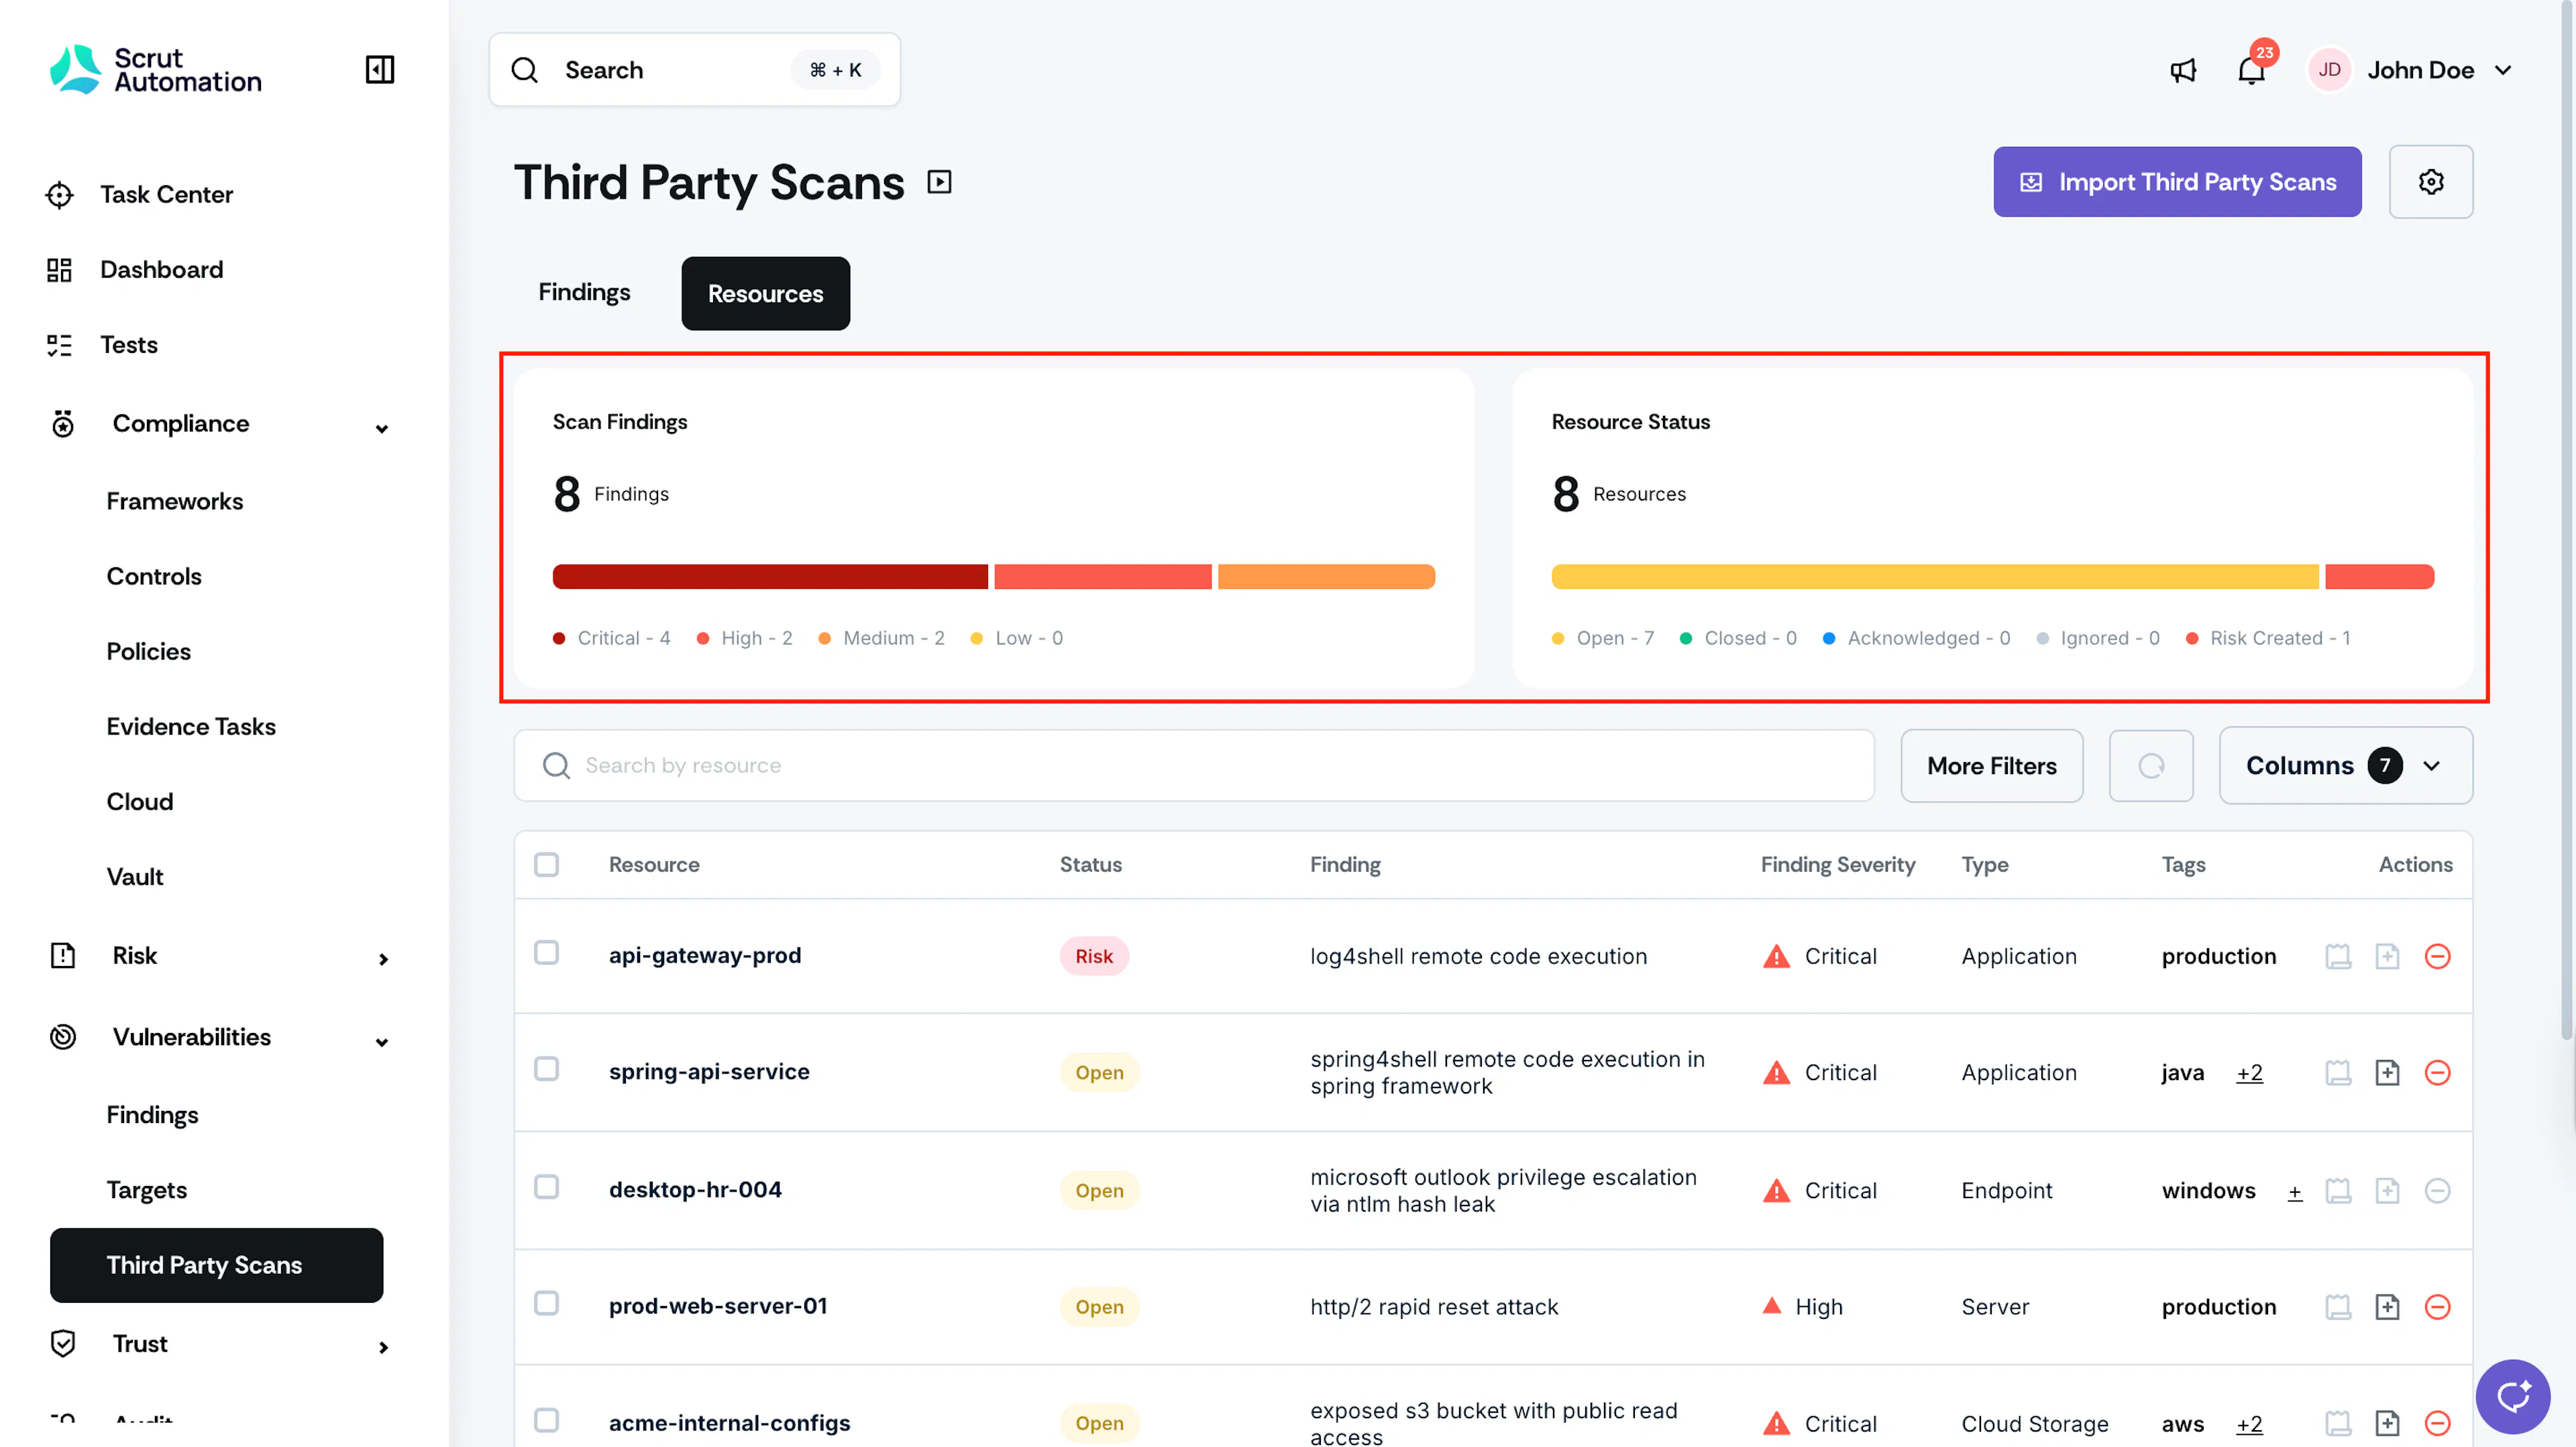
Two summary cards at the top keep you oriented:
- Scan Findings shows the total number of findings across all resources, by severity (Critical, High, Medium, or Low).
- Resource Status shows the total number of resources and their distribution across statuses: Open, Closed, Acknowledged, Ignored, and Risk Created.
Browse and Filter Your Resources
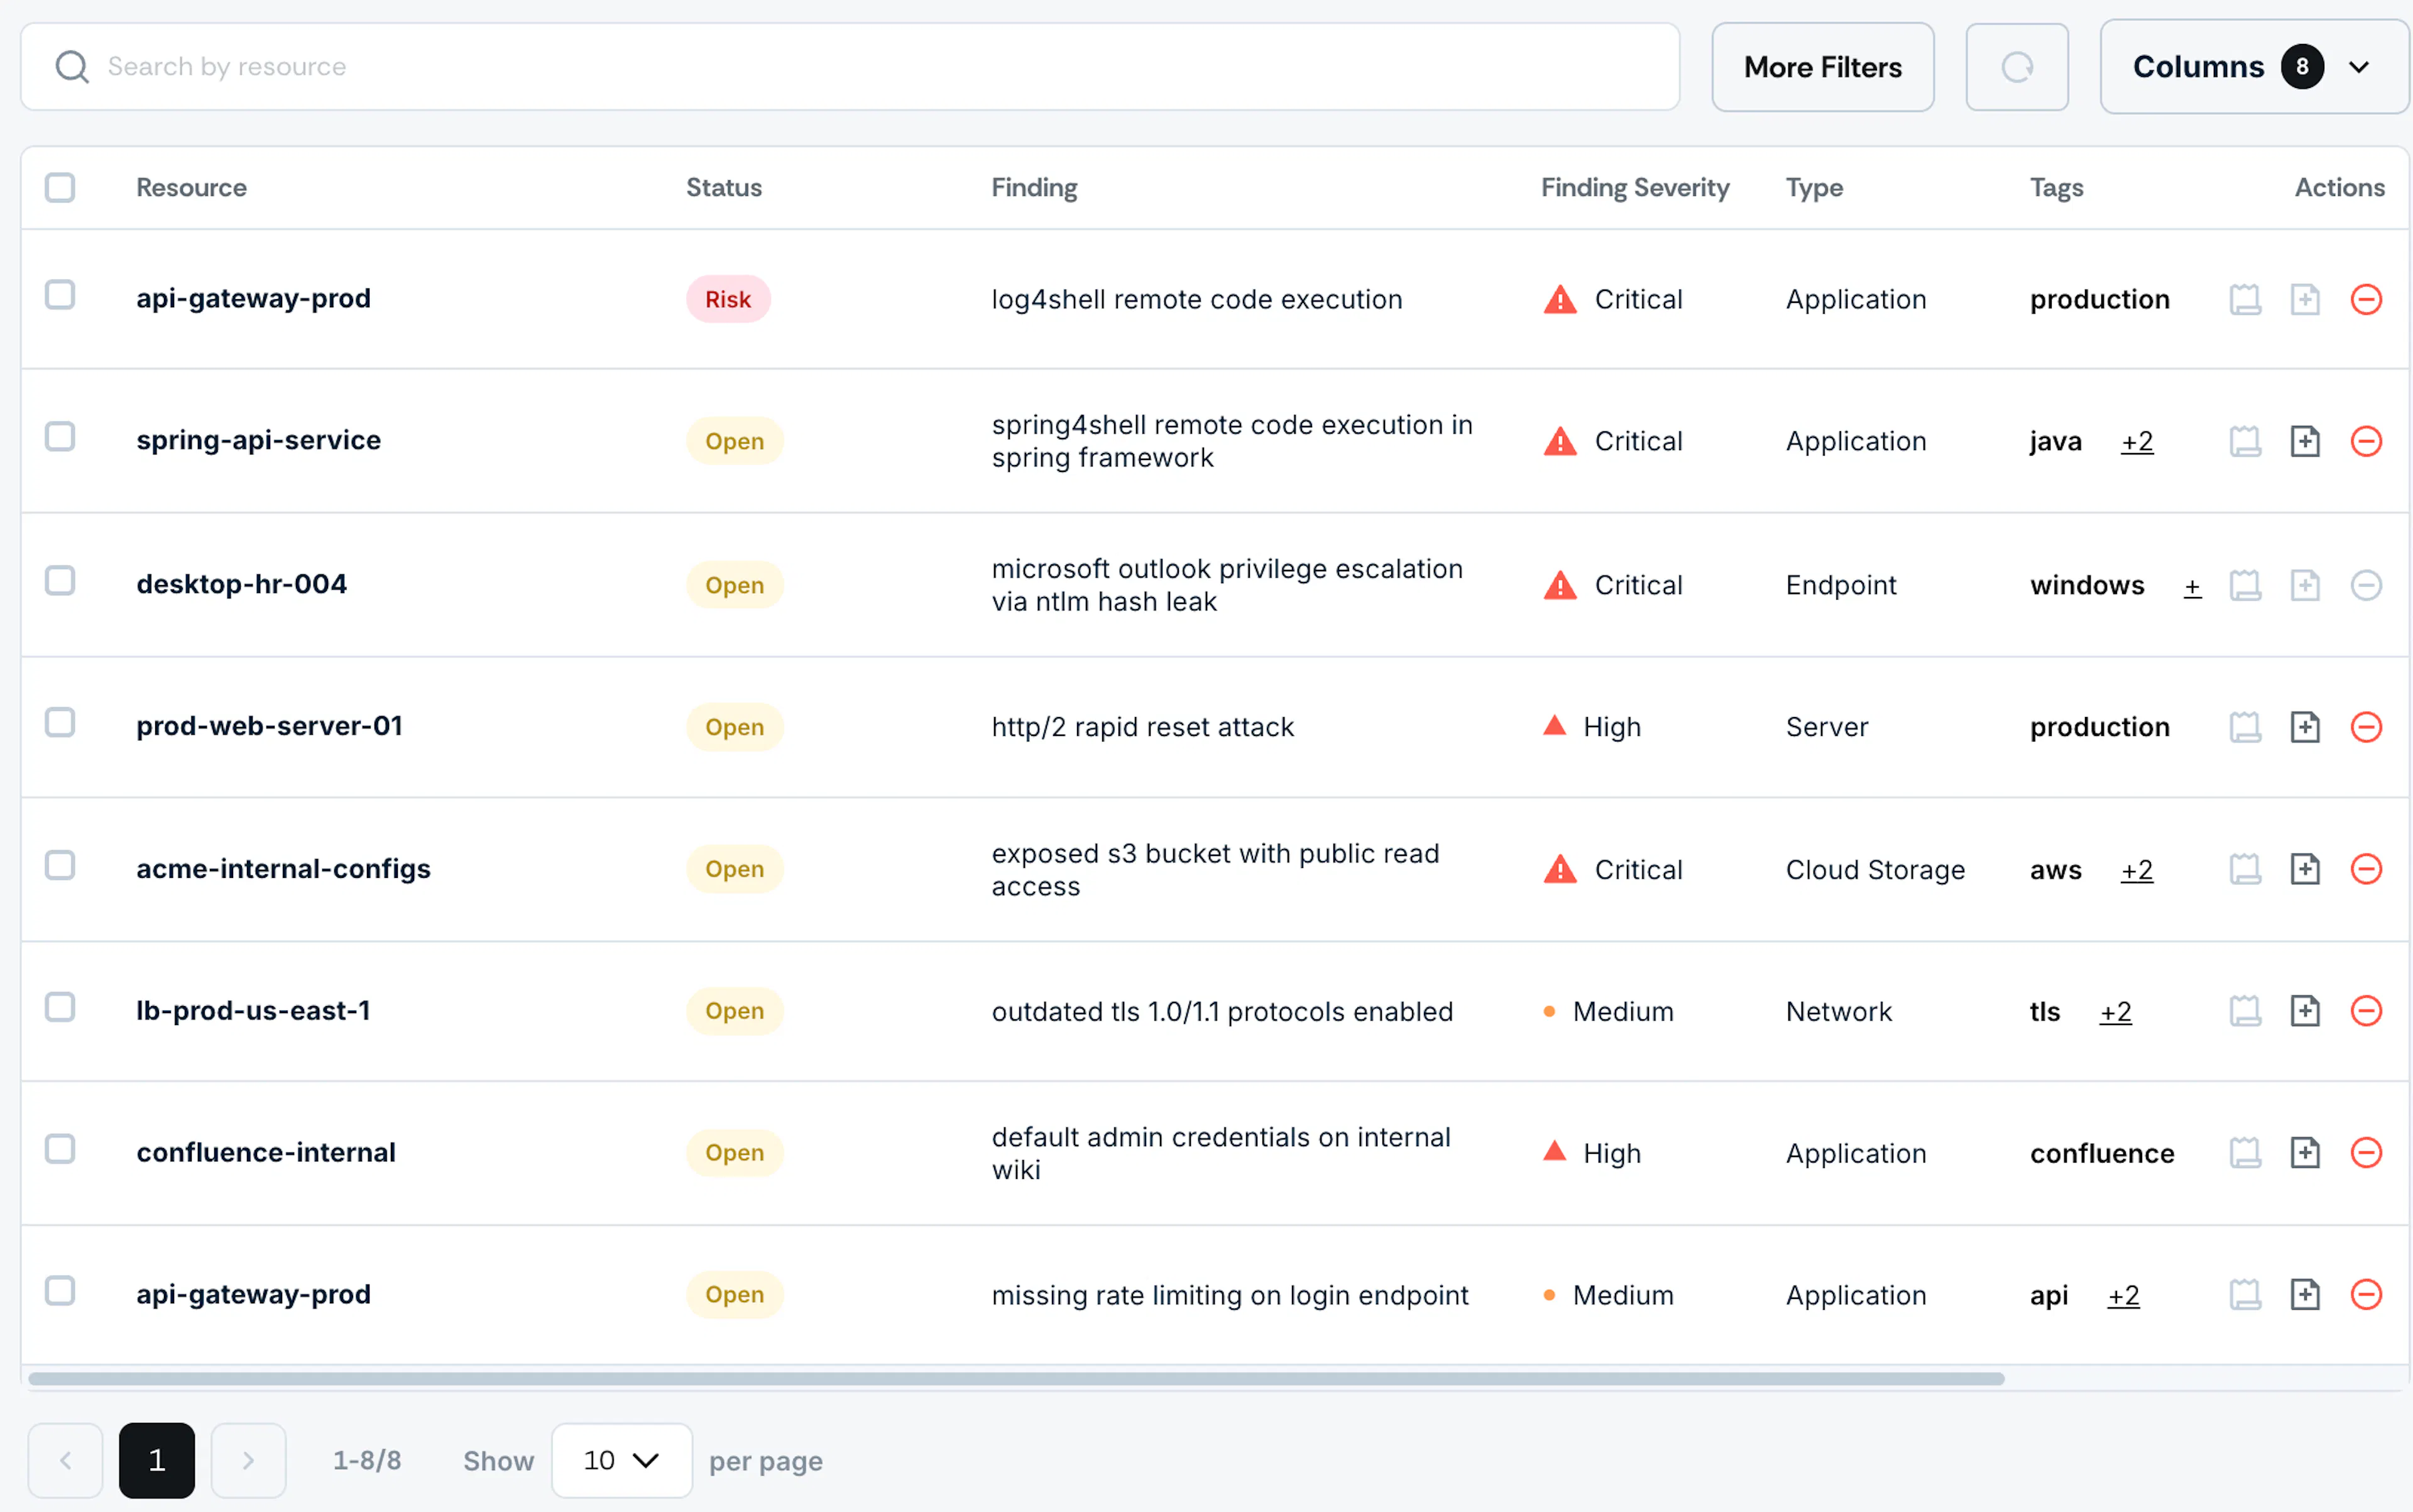
The resources table lists each affected asset alongside its associated findings. Each row shows the resource name, its current status, the linked finding, finding severity, type, date first seen, and tags.
To focus your view:
- Use the search bar to look up a specific resource by name.
- Click Filters to narrow results by severity, source, or other attributes.
- Click Columns to add or remove columns. First Seen is available as an optional column and is hidden by default.
Drill Into a Resource
Click any row to open the full detail page for that resource. The detail page shows all findings tied to that resource in one place, so you can assess its full exposure without navigating between individual CVEs.
Take Action from the Resources Tab
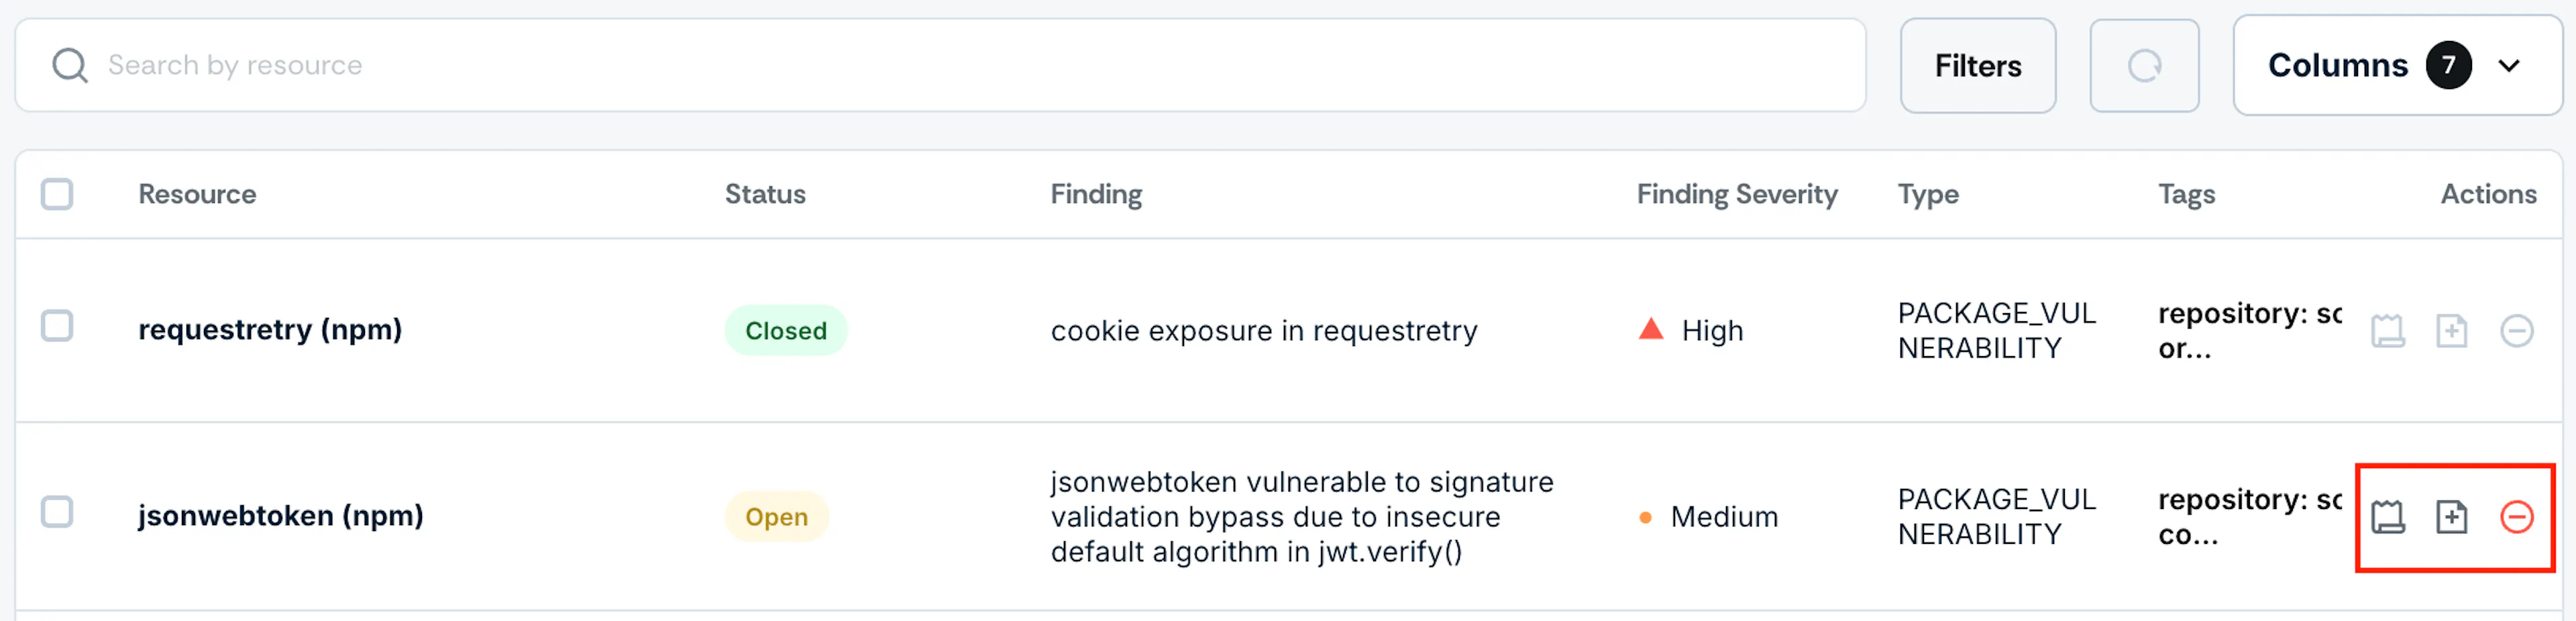
The same actions available on the Findings tab are also available here. Use the Create Jira Ticket, Create Risk, and Ignore icons in the Actions column to triage findings directly from the resources table.